


Indicadores
| Título del ítem | Sumario | Categorías | Creado | ||||||||||||||||||||||||||||||||||||||||||||||||||||||||||||||||||||||||||||||||||||||||||||||||||||||||||||||||||||||||||||||||||||||||||||||||||||||||||||||||||||||||||||||||||||||||||||||||||||||||||||||||||||||||||||||||||||||||||||||||||||||||||||||||||||||||||||||||||||||||||||||||||||||||||||||||||||||||||||||||||||||||||||||||||||||||||||||||||||||||||||||||||||||||||||||||||||||||||||||||||||||||||||||||||||||||||||||||||||||||||||||||||||||||||||||||||||||||||||||||||||||||||||||||||||||||||||||||||||||||||||||||||||||||||||||||||||||||||||||||||||||||||||||||||||||||||||||||||||||||||||||||||||||||||||||||||||||||||||||||||||||||||||||||||||||||||||||||||||||||||||||||||||||||||||||||||||||||||||||||||||||||||||||||||||||||||||||||||||||||||||||||||||||||||||||||||||||||||||||||||||||||||||||||||||||||||||||||||||||||||||||||||||||||||||||||||||||||||||||||||||||||||||||||||||||||||||||||||||||||||||||||||||||||||||||||||||||||||||||||||||||||||||||||||||||||||||||||||||
|---|---|---|---|---|---|---|---|---|---|---|---|---|---|---|---|---|---|---|---|---|---|---|---|---|---|---|---|---|---|---|---|---|---|---|---|---|---|---|---|---|---|---|---|---|---|---|---|---|---|---|---|---|---|---|---|---|---|---|---|---|---|---|---|---|---|---|---|---|---|---|---|---|---|---|---|---|---|---|---|---|---|---|---|---|---|---|---|---|---|---|---|---|---|---|---|---|---|---|---|---|---|---|---|---|---|---|---|---|---|---|---|---|---|---|---|---|---|---|---|---|---|---|---|---|---|---|---|---|---|---|---|---|---|---|---|---|---|---|---|---|---|---|---|---|---|---|---|---|---|---|---|---|---|---|---|---|---|---|---|---|---|---|---|---|---|---|---|---|---|---|---|---|---|---|---|---|---|---|---|---|---|---|---|---|---|---|---|---|---|---|---|---|---|---|---|---|---|---|---|---|---|---|---|---|---|---|---|---|---|---|---|---|---|---|---|---|---|---|---|---|---|---|---|---|---|---|---|---|---|---|---|---|---|---|---|---|---|---|---|---|---|---|---|---|---|---|---|---|---|---|---|---|---|---|---|---|---|---|---|---|---|---|---|---|---|---|---|---|---|---|---|---|---|---|---|---|---|---|---|---|---|---|---|---|---|---|---|---|---|---|---|---|---|---|---|---|---|---|---|---|---|---|---|---|---|---|---|---|---|---|---|---|---|---|---|---|---|---|---|---|---|---|---|---|---|---|---|---|---|---|---|---|---|---|---|---|---|---|---|---|---|---|---|---|---|---|---|---|---|---|---|---|---|---|---|---|---|---|---|---|---|---|---|---|---|---|---|---|---|---|---|---|---|---|---|---|---|---|---|---|---|---|---|---|---|---|---|---|---|---|---|---|---|---|---|---|---|---|---|---|---|---|---|---|---|---|---|---|---|---|---|---|---|---|---|---|---|---|---|---|---|---|---|---|---|---|---|---|---|---|---|---|---|---|---|---|---|---|---|---|---|---|---|---|---|---|---|---|---|---|---|---|---|---|---|---|---|---|---|---|---|---|---|---|---|---|---|---|---|---|---|---|---|---|---|---|---|---|---|---|---|---|---|---|---|---|---|---|---|---|---|---|---|---|---|---|---|---|---|---|---|---|---|---|---|---|---|---|---|---|---|---|---|---|---|---|---|---|---|---|---|---|---|---|---|---|---|---|---|---|---|---|---|---|---|---|---|---|---|---|---|---|---|---|---|---|---|---|---|---|---|---|---|---|---|---|---|---|---|---|---|---|---|---|---|---|---|---|---|---|---|---|---|---|---|---|---|---|---|---|---|---|---|---|---|---|---|---|---|---|---|---|---|---|---|---|---|---|---|---|---|---|---|---|---|---|---|---|---|---|---|---|---|---|---|---|---|---|---|---|---|---|---|---|---|---|---|---|---|---|---|---|---|---|---|---|---|---|---|---|---|---|---|---|---|---|---|---|---|---|---|---|---|---|---|---|---|---|---|---|---|---|---|---|---|---|---|---|---|---|---|---|---|---|---|---|---|---|---|---|---|---|---|---|---|---|---|---|---|---|---|---|---|---|---|---|---|---|---|---|---|---|---|---|---|---|---|---|---|---|---|---|---|---|---|---|---|---|---|---|---|---|---|---|---|---|---|---|---|---|---|---|---|---|---|---|---|---|---|---|---|---|---|---|---|---|---|---|---|---|---|---|---|---|---|---|---|---|---|---|---|---|---|---|---|---|---|---|---|---|---|---|---|---|---|---|---|---|---|---|---|---|---|---|---|---|---|---|---|---|---|---|---|---|---|---|---|---|---|---|---|---|---|---|---|---|---|---|---|---|---|---|---|---|---|---|---|---|---|---|---|---|---|---|---|---|---|---|---|---|---|---|---|---|---|---|---|---|---|---|---|---|---|---|---|---|---|---|---|---|---|---|---|---|---|---|---|---|---|---|---|---|---|---|---|---|---|---|---|---|---|---|---|---|---|---|---|---|---|---|---|---|---|---|---|---|---|---|---|---|---|---|---|---|---|---|---|---|---|---|---|---|---|---|---|---|---|---|---|---|---|---|---|---|---|---|---|---|---|---|---|---|---|---|---|---|---|---|---|---|---|---|---|---|---|---|---|---|---|---|---|---|---|---|---|---|---|---|---|---|---|---|---|---|---|---|---|---|---|---|---|---|---|---|---|---|---|---|---|---|---|---|---|---|---|---|---|---|---|---|---|---|---|---|---|---|---|---|---|---|---|---|---|---|---|---|---|---|---|
| France : Baisse historique de la production d'aliments en 2022 | En 2022, les fabricants d’aliments français enregistrent une baisse globale d’activité de 6,6% par rapport à 2021 perdant près d’un million et demi de tonne d’aliments composés pour s’établir à 19,2 Mt. 
 En recul de 800 000 T (- 10,2%), La demande en aliments volailles, surtout ceux destinés à la volaille de chair, a tout particulièrement été affectée par l’épidémie d’influenza aviaire qui a touché de plein fouet la filière avicole. Les aliments pour palmipèdes sont les plus touchés avec une baisse de 30% de la production en 2022. Pour le porc, le secteur enregistre une perte de 300 000 tonnes d’aliments, dans un contexte de décapitalisation du cheptel de truies et de baisse de production de la filière porcine française. Les aliments ruminants enregistrent une baisse plus modérée, surtout localisée sur les filières « bovins allaitants ». Le contexte de décapitalisation dans la filière bovine explique en partie cette observation. En filière laitière, l’impact de cette décapitalisation a été en grande partie compensée par un niveau de production laitière soutenu, à la faveur de l’amélioration des cours du lait. L’année 2022 a également été marquée par les conséquences de la guerre entre la Russie et l’Ukraine. Le coût de l’alimentation des animaux a été largement impacté par la hausse généralisée des matières premières, par les difficultés logistiques, les tensions sur les disponibilités et la hausse du prix des énergies (gaz, électricité, carburant). L’aide résilience mise en place par le Gouvernement au premier semestre 2022 a certes permis d’en limiter l’impact brutal pour les éleveurs mais n’a pas pour autant freiné les arrêts d’élevage.
Mars 2023/ SNIA / France. |
Francia | Intersectorial | Mercados | Producción | Sábado, 18 Marzo 2023 | ||||||||||||||||||||||||||||||||||||||||||||||||||||||||||||||||||||||||||||||||||||||||||||||||||||||||||||||||||||||||||||||||||||||||||||||||||||||||||||||||||||||||||||||||||||||||||||||||||||||||||||||||||||||||||||||||||||||||||||||||||||||||||||||||||||||||||||||||||||||||||||||||||||||||||||||||||||||||||||||||||||||||||||||||||||||||||||||||||||||||||||||||||||||||||||||||||||||||||||||||||||||||||||||||||||||||||||||||||||||||||||||||||||||||||||||||||||||||||||||||||||||||||||||||||||||||||||||||||||||||||||||||||||||||||||||||||||||||||||||||||||||||||||||||||||||||||||||||||||||||||||||||||||||||||||||||||||||||||||||||||||||||||||||||||||||||||||||||||||||||||||||||||||||||||||||||||||||||||||||||||||||||||||||||||||||||||||||||||||||||||||||||||||||||||||||||||||||||||||||||||||||||||||||||||||||||||||||||||||||||||||||||||||||||||||||||||||||||||||||||||||||||||||||||||||||||||||||||||||||||||||||||||||||||||||||||||||||||||||||||||||||||||||||||||||||||||||||||||||
| Recycle-ready and lifestyle-compatible: Changing consumer demands driving packaging innovation in APAC |  According to an Amcor survey involving 12,000 consumers in six countries, 76% of respondents said that they want to recycle more than they currently do. “The trends that we are seeing reflect consumers’ changing priorities and lifestyles. From format substitution (rigid to flexible) to recycle-ready packaging and those that use less materials, we are working to provide responsible, sustainable and high-performance packaging that consumers are looking for,” Dr Lu Qiang, R&D Vice President of Amcor Flexibles Asia Pacific, told FoodNavigator-Asia. At the same time, the firm has observed a preference for product packaging that is easy and convenient to use, such as portable squeeze pouches and resealable packs, due to modern on-the-go lifestyles. To stand out on the shelves, brands are increasingly leaning towards customised packaging to “build relationships and drive loyalty”. These include sensory packaging, digital printing, and unique finishes. Furthermore, health and hygiene remain an important concern for consumers. “Packaging and labels that communicate honestly about product ingredients help to build trust with consumers — for example, transparent packaging that show freshness of the item,” Dr Lu explained. Blazing the trailRecognising the demand, Amcor has invested US$100m to set up a new flexible packaging plant in Huizhou, China. The 590,000 square feet facility is said to have the largest production capacity in the country, and will play a major role in the production of flexible packaging for food and personal care products. “The new plant is the latest addition to our manufacturing network in Asia-Pacific (APAC), where we will continue to invest in building capabilities and capacity to fulfil growing demand. That way, we can bring Amcor’s innovations and expertise closer to our customers in the region,” said Dr Lu. The plant boasts a number of firsts in China, including the first automated packaging production line. This, along with high-speed printing presses, laminators and bag-making machines, would bring double-digit reduction in manufacturing cycle time. It is also the first in the Chinese flexible packaging industry to deploy a smart production and operation system, which includes smart laser scanners, light curtains, high-standard machine guarding, and multiple quality-control points. As part of Amcor’s efforts to minimise adverse environmental impact, the new plant is equipped with several sustainability features, such as regenerative thermal oxidizers (RTO) to reduce harmful emissions, as well as energy-saving, heat-recovery, low-power consumption and rainwater-harvesting systems. In addition, the facility houses three labs with innovative testing and analytical capabilities. Specifically, they are the Workshop lab to test semi-finished and finished products, the Central lab to test raw materials and conduct product development research, and the Microbiological testing lab to detect and control bacteria, and monitor environmental hygiene. These three labs leverage expertise and technologies from the Amcor Asia Pacific Innovation Center, a regional R&D hub and member of the firm’s global innovation network, located in Jiangyin, China. “This not only enables us to accelerate the development of responsible packaging solutions and commercialisation of new products, but also ensure they meet the strict quality standards that consumers demand,” Dr Lu added. Target 2025In 2018, Amcor pledged to make all its packaging products recyclable or reusable by 2025. To achieve this goal, the firm puts about US$100m every year into the development of sustainable products. “We have a coordinated global R&D effort to develop sustainable products utilising materials such as mono-layer plastic films, paper, post-consumer recycled plastics, and biodegradable materials,” Dr Lu shared. The firm’s range of proprietary recycle-ready products include AmPrima’s dry and liquid pouches, bread bags and lidding film for trays, and AmFiber’s paper-based packaging for baked goods, fresh fruit and vegetables, meats and seafood, snacks and more. Another portfolio highlight is the AmLite HeatFlex Recycle-Ready, which is claimed to be the world’s first recyclable packaging that possesses “excellent barrier properties for high performance” under retort and heat treatment to provide long shelf life. This packaging is typically used for ready meals, baby nutrition products, beverages, and cooking aids. “We aim to bring these products to our customers in APAC by transferring the technology and manufacturing them in the region itself,” Dr Lu reiterated. |
Mundial | Mercados | Envases y etiquetado | Intersectorial | Miércoles, 15 Marzo 2023 | ||||||||||||||||||||||||||||||||||||||||||||||||||||||||||||||||||||||||||||||||||||||||||||||||||||||||||||||||||||||||||||||||||||||||||||||||||||||||||||||||||||||||||||||||||||||||||||||||||||||||||||||||||||||||||||||||||||||||||||||||||||||||||||||||||||||||||||||||||||||||||||||||||||||||||||||||||||||||||||||||||||||||||||||||||||||||||||||||||||||||||||||||||||||||||||||||||||||||||||||||||||||||||||||||||||||||||||||||||||||||||||||||||||||||||||||||||||||||||||||||||||||||||||||||||||||||||||||||||||||||||||||||||||||||||||||||||||||||||||||||||||||||||||||||||||||||||||||||||||||||||||||||||||||||||||||||||||||||||||||||||||||||||||||||||||||||||||||||||||||||||||||||||||||||||||||||||||||||||||||||||||||||||||||||||||||||||||||||||||||||||||||||||||||||||||||||||||||||||||||||||||||||||||||||||||||||||||||||||||||||||||||||||||||||||||||||||||||||||||||||||||||||||||||||||||||||||||||||||||||||||||||||||||||||||||||||||||||||||||||||||||||||||||||||||||||||||||||||||||
| ChatGPT, lintelligence artificielle et notre assiette |  « L’accès gratuit à une plateforme comme ChatGPT pourrait avoir une incidence sur la façon dont l’industrie alimentaire utilisera l’intelligence artificielle à l’avenir. » Nous savons tous que l’utilisation de l’intelligence artificielle (IA) au sein de l’industrie alimentaire se fait plus lentement que dans d’autres secteurs. Pour la première fois, des technologies comme ChatGPT permettent aux consommateurs d’apprécier pleinement le pouvoir et la puissance de l’IA et la façon dont elle peut changer leur propre monde. Alors que Facebook a atteint son millionième membre en dix mois, il n’aura fallu que cinq jours à ChatGPT pour compter un million de membres.Les entreprises alimentaires ont toujours été prises dans cette symétrie capricieuse entre traditions, cultures et technologies. L’utilisation de nouvelles approches avancées ne peut se faire au détriment de ce que représente l’alimentation pour les consommateurs et les collectivités. L’IA va changer notre monde, comme Internet l’a fait. Et cela aura également le potentiel de changer l’industrie alimentaire. OpenAI, financée par Elon Musk dès 2015, a conçu ChatGPT. Cette dernière plateforme a décidé d’offrir une démo publique pour démontrer au monde entier les capacités de l’IA. Depuis, tout le monde se questionne sur l’utilité d’une telle plateforme et de l’IA. Pour le secteur alimentaire, l’accès à un tel outil risque de changer la donne. Il suffit de penser au gaspillage alimentaire. Avec l’IA et les étiquettes intelligentes, il devient possible d’accéder à plus de données sur la durée de conservation des aliments à la maison avant de jeter quoi que ce soit. Les dates de péremption deviendraient obsolètes et les rappels aussi. Les étiquettes, réfrigérateurs, téléphones cellulaires et montres nous informeraient si un produit fait l’objet d’un rappel, éliminant ainsi l’obligation de se fier aux nouvelles. Le modèle utilisé lors d’un rappel d’aliment qui consiste à tout jeter deviendra clairement dépassé. L’application COVID durant la pandémie a été développée pour assurer notre sécurité. Nous pouvons certainement développer une meilleure technologie et faire de même pour les rappels de produits alimentaires en utilisant l’IA pour assurer notre sécurité. Nos visites à l’épicerie changeront sûrement elles aussi. Avant de partir pour l’épicerie, il suffirait de demander à l’IA d’optimiser notre alimentation en fonction de ce qui est le plus abordable ce jour-là avant de parcourir physiquement les allées du magasin. Éventuellement, la numérisation du visage ou des doigts des clients à l’entrée d’un détaillant aurait la possibilité de fournir l’accès à des suggestions sur les ingrédients requis pour faire une recette donnée en fonction de vos propres besoins, de la taille de votre ménage, de vos préférences et restrictions alimentaires, etc. Le même procédé s’appliquerait lors d’une visite au restaurant. L’élaboration des menus en serait également influencée. D’ailleurs, le premier livre de cuisine comportant des recettes entièrement créées par l’IA se retrouve déjà sur les tablettes des libraires depuis quelques mois. Pour l’industrie, certaines pratiques changeront. Sachant que les consommateurs sont mieux outillés pour faire face à la hausse des prix alimentaires, les épiciers auront probablement recours à une approche de gestion de prix plus dynamique. Par exemple, si un produit se vend beaucoup, son prix risque d’augmenter à la minute à l’aide d’étiquettes numériques. Cela se produit déjà dans de nombreux endroits à travers le monde. La recherche d’un équilibre idéal entre l’offre et la demande pourrait stabiliser les prix alimentaires. Un taux d’inflation alimentaire de 10 % est tout simplement cruel et insoutenable, tant pour les consommateurs que pour l’industrie. En haut de la chaîne alimentaire, l’IA est déjà bien installée. Les algorithmes d’IA aident les agriculteurs à analyser les données sur le sol, le climat et les cultures pour prévoir le rendement des récoltes, optimiser les calendriers d’irrigation et de fertilisation et améliorer l’efficacité des pratiques agricoles. Cette assistance sera aussi en mesure d’apporter un appui important à la chaîne d’approvisionnement. L’IA facilitera la prévision des perturbations de la chaîne d’approvisionnement et l’optimisation des calendriers de livraison, tout en réduisant l’effet de « mise en rayon » lorsque la durée de conservation d’un produit est compromise par un problème sur le plan de la chaîne d’approvisionnement. Avec ChatGPT et d’autres sites Web émergents de dialogueurs, nous comprendrons mieux ce qui nous attend. L’industrie alimentaire, en particulier les épiciers, réagira probablement en adoptant davantage de technologies et en utilisant les consommateurs comme participants actifs. Mais l’IA n’aura pas une réponse pour chaque défi auquel l’industrie alimentaire est confrontée. La technologie n’a pas d’éthique ni de morale, et aujourd’hui la nourriture est une question d’éthique et de morale. Alors L’IA n’est pas la solution pour tous nos problèmes. |
Mundial | Clientes | Mercados | Intersectorial | Martes, 14 Marzo 2023 | ||||||||||||||||||||||||||||||||||||||||||||||||||||||||||||||||||||||||||||||||||||||||||||||||||||||||||||||||||||||||||||||||||||||||||||||||||||||||||||||||||||||||||||||||||||||||||||||||||||||||||||||||||||||||||||||||||||||||||||||||||||||||||||||||||||||||||||||||||||||||||||||||||||||||||||||||||||||||||||||||||||||||||||||||||||||||||||||||||||||||||||||||||||||||||||||||||||||||||||||||||||||||||||||||||||||||||||||||||||||||||||||||||||||||||||||||||||||||||||||||||||||||||||||||||||||||||||||||||||||||||||||||||||||||||||||||||||||||||||||||||||||||||||||||||||||||||||||||||||||||||||||||||||||||||||||||||||||||||||||||||||||||||||||||||||||||||||||||||||||||||||||||||||||||||||||||||||||||||||||||||||||||||||||||||||||||||||||||||||||||||||||||||||||||||||||||||||||||||||||||||||||||||||||||||||||||||||||||||||||||||||||||||||||||||||||||||||||||||||||||||||||||||||||||||||||||||||||||||||||||||||||||||||||||||||||||||||||||||||||||||||||||||||||||||||||||||||||||||||
| Tastewise launches consumer insights chatbot |  TEL AVIV, ISRAEL — Tastewise, a data-driven platform that uses artificial intelligence (AI) to help food and beverage brands develop and market new products, is launching its newest AI-based service, a conversational chatbot dubbed TasteGPT. The chatbot is designed to reduce research and development times while increasing productivity for the company’s clientele, including brands like Nestle SA, PepsiCo, Inc., Campbell Soup Co. and Kraft Heinz Co. TasteGPT can answer companies’ insight and innovation questions in a matter of seconds, drawing on Tastewise’s dataset of best-selling restaurant items, social media interactions and home recipes. The AI also provides real-time product, menu and marketing recommendations. It can give feedback on what products are best fit for a company’s Gen Z consumers, where initial product launches should take place or what R&D concepts a brand should invest in, for example. Customers also can use the TasteGPT to generate reports and decks on trends, ingredient pairings and more. The launch comes just over a year after Tastewise raised $17 million in a Series A funding round. |
Mundial | Proveedores | Intersectorial | Lunes, 13 Marzo 2023 | ||||||||||||||||||||||||||||||||||||||||||||||||||||||||||||||||||||||||||||||||||||||||||||||||||||||||||||||||||||||||||||||||||||||||||||||||||||||||||||||||||||||||||||||||||||||||||||||||||||||||||||||||||||||||||||||||||||||||||||||||||||||||||||||||||||||||||||||||||||||||||||||||||||||||||||||||||||||||||||||||||||||||||||||||||||||||||||||||||||||||||||||||||||||||||||||||||||||||||||||||||||||||||||||||||||||||||||||||||||||||||||||||||||||||||||||||||||||||||||||||||||||||||||||||||||||||||||||||||||||||||||||||||||||||||||||||||||||||||||||||||||||||||||||||||||||||||||||||||||||||||||||||||||||||||||||||||||||||||||||||||||||||||||||||||||||||||||||||||||||||||||||||||||||||||||||||||||||||||||||||||||||||||||||||||||||||||||||||||||||||||||||||||||||||||||||||||||||||||||||||||||||||||||||||||||||||||||||||||||||||||||||||||||||||||||||||||||||||||||||||||||||||||||||||||||||||||||||||||||||||||||||||||||||||||||||||||||||||||||||||||||||||||||||||||||||||||||||||||||
| Health and Wellness Series – Functional foods and beverages in Japan | Note: This report includes forecasting data that is based on baseline historical data. Executive summaryOverall, the Health and wellness (HW) food and beverage sector in Japan reached a retail sales value of US$55.1 billion in 2021, which stayed the same at a compound annual growth rate (CAGR) of 0.0% between 2016 and 2021 and are expected to continue to grow at a CAGR of 1.6% (2021-2026). During the pandemic, Japanese remained alert and refrained from going out of home. This made the retail sales of HW foods and beverages remain stagnant, no growth at all between 2016 and 2021. In 2021, among H&W foods and beverages, a total of 40.3% of the market were from within the HW packaged food category (US$23.2 billion), with fortified/functional (FF) packaged food products representing the highest sales value at US$11.7 billion, followed by Free From products (US$5.4 billion) and naturally healthy (NH) packaged food (US$2.9 billion). The HW packaged food grew at A CAGR of 0.7% between 2016 and 2021 and is expected to grow at a CAGR of 1.6% between 2021 and 2026. H&W packaged beverage products represented the remaining 59.7% market in retail share value, reaching sales of US$31.9 billion, thriving the most from within the FF, NH and better for you (BFY) related drink categories. Although the CAGR growth is negative between 2016 and 2021, but will expect to be bounced back to 1.7% between 2021 and 2026, reaching US$34.7 billion in 2026. FF dairy was the largest category (US$6.9 billion) within FF packaged foods in 2021, representing almost 50.6% total market share. FF confectionery was the second largest in retail value (US$2.2 billion) in 2021. It is worth noting that FF yoghurt represented 89.0% of the entire FF dairy, reaching US$5.9 billion. Market overviewHealth and wellness (HW) is the combination of organic food and beverages, fortified/functional (FF) food and beverages, naturally healthy (NH) food and beverages, better for you (BFY) food and beverages and food intolerance products. Overall, the HW food and beverage sector in Japan reached a retail sales value of US$55.1 billion in 2021, which stayed the same at a compound annual growth rate (CAGR) of 0.0% between 2016 and 2021 and are expected to continue to grow at a CAGR of 1.6% (2021-2026). During the pandemic, Japanese remained alert and refrained from going out of home. This made the retail sales of H & W foods and beverages remain stagnant, no growth at all between 2016 and 2021. In 2021, among HW foods and beverages, a total of 40.3% of the market were from within the HW packaged food category (US$23.2 billion), with FF packaged food products representing the highest sales value at US$11.7 billion, followed by Free From products (US$5.4 billion) and NH packaged food (US$2.9 billion). The HW packaged food grew at a CAGR of 0.7% between 2016 and 2021 and is expected to grow at a CAGR of 1.6% between 2021 and 2026. HW packaged beverage products represented the remaining 59.7% market in retail share value, reaching sales of US$31.9 billion, thriving the most from within the FF, NH and BFY related drink categories. Although the CAGR growth is negative between 2016 and 2021, but will expect to be bounced back to 1.7% between 2021 and 2026, reaching US$34.7 billion in 2026.
Retail salesFF packaged food products reached US$11.7 billion in 2021 from US$11.5 billion in 2016. FF dairy was the largest category (US$6.9 billion) within FF packaged foods in 2021, representing almost 50.6% total market share. FF confectionery was the second largest in retail value (US$2.2 billion) in 2021. It is worth noting that FF yoghurt represented 89.0% of the entire FF dairy, reaching US$5.9 billion. The FF cheese subcategory had the fastest growth at a CAGR of 3.8% (2016-2021). It is expected to grow at CAGR of 3.4% between 2021 and 2026.
FF beverages experienced negative growth than FF packaged food products in market size from 2016 to 2021, with a −0.2% CAGR. But they are expected to grow at a CAGR of 2.0%. FF Plant-based and malt-based hot drinks was the fastest-growing subcategory during the period at a CAGR of 25.6%, reaching US$50.9 million in 2021. FF Carbonates are expected to grow at a CAGR of 3.1% between 2021 and 2026, followed by FF concentrates at a CAGR of 2.5%, reaching US$49.7 million in 2026.
Distribution channelFF foods and beverages were distributed mainly through store-based retailing at 88.7% in 2016 but slightly decreased to 88.3% in 2021. Non-store retailing, though represented 11.3% in 2016, but increased to 11.7% in 2021. Especially the E-Commerce recorded the fastest CAGR growth at 3.2% in actual retail value table or 2.9% in per centage table from 2016 to 2021, reaching US$985.6 million in 2021.
Top company retail sharesIn 2021, leading companies in the FF packaged food category were fairly distributed and included the Yakult Honsha Co Ltd at an 10.4% retail share value, Meiji Holdings Co Ltd (9.2%), and the Otsuka Holdings Co Ltd (8,8%).
Top leaders within the FF drink category included Coca-Cola Co, 18.6%, followed by Suntory Holdings Ltd (16.0%), and Asahi Group Holdings Ltd (14.4%) in 2021.
New product launch analysisAccording to Mintel's Global New Products Database (GNPD), there were 5,843 launches of functional food and beverage products in Japan between January 2017 and December 2021. Among which, 3,981 were functional food, 1,853 were functional drink. 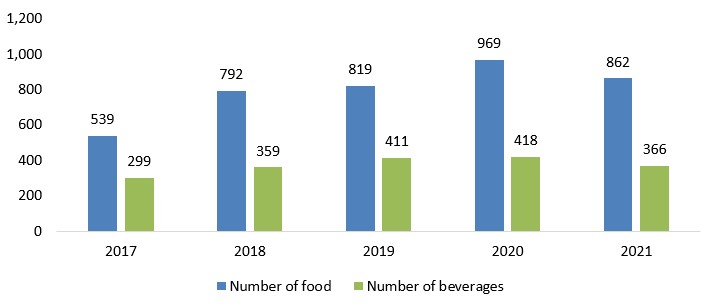
Description of above image
Source: Mintel, 2022 In 2021, the top five functional packaged food products manufacturers were located in Japan, Thailand, Netherland, China and South Korea. The top five brands were Topvalu, Nissin York Tokachi Nomu Yogurt, Glico Sunao, Kanro Puré Gummy and Kanro. The top ingredient claims were vegetable based, domestic, dietary, for baking and top.
In 2021, the top five manufacturers of the functional beverages were located in Japan, China, South Korea, German and Singapore. The top five brands were Kagome Yasai Seikatsu 100, Meiji Savas, Topvalu, Sujahta Meiraku Kazoku No Uruoi and Asahi Style Balance. The top ingredient claims were vegetable based, domestic, dietary, green and imported.
Examples of new product launchesBitter Chocolate Cream Biscuit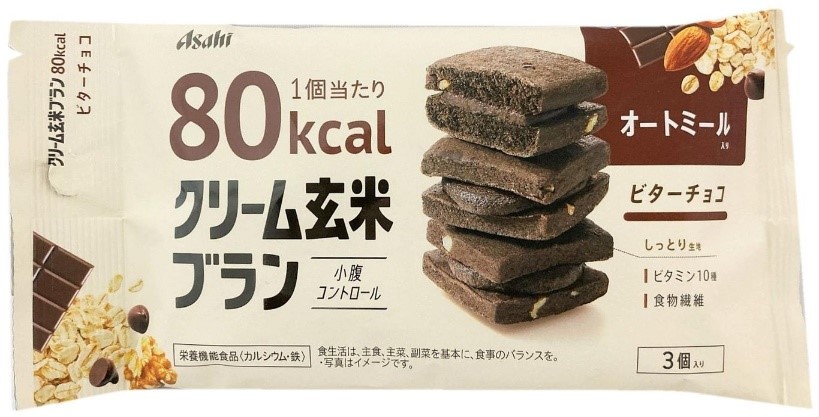 Source: Mintel, 2022
Asahi Cream Genmai Bran 80kcal Bitter Chocolate Cream Biscuit is now available. The moist biscuits are made with oatmeal to enhance satiety and contain 10 vitamins, dietary fibre, added calcium for bones and teeth, and fortified iron, which is important for the formation of red blood cells. The product provides only 80kcal per unit and retails in a 54 gram pack with three units. Launched on October 11, 2021. Recommended retail price not available. Vanilla Flavour Protein Powder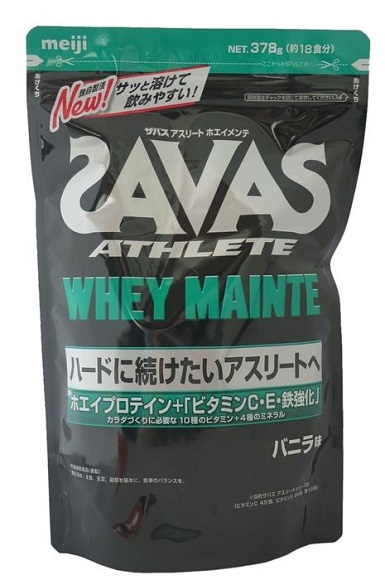 Source: Mintel, 2022
Meiji Savas Athlete Whey Mainte Vanilla Flavour Protein Powder is now available. This product is said to be for athletes who want to keep training hard for an extended time and contains whey protein as well as ten vitamins and four minerals which are necessary when body building. It has an amino acid score of 100 and contains 4.5 times more vitamin C, 3.4 times more vitamin E and 1.5 times more iron than Meiji Savas Athlete protein powders, as well as six B vitamins, vitamins A and D, zinc, calcium and magnesium. It contains 75% protein, comprising 100% whey which is easily absorbable and said to be ideal for protein intake directly after training. The zinc is said to support eyesight but is also useful in the metabolism of proteins and nucleic acids and to support the health of the skin and mucous membranes. The product is said to dissolve quickly and to be easy to drink, and can also be eaten with breakfast, after a meal, or one hour before bed. It can be prepared by mixing 21 grams with 300 millilitres water or milk and retails in a 378 gram pack with a zipper, sufficient for 18 portions, containing a spoon and featuring a QR code. Launched in March, 2021, with a recommended retail price of 3,564 yen. Mixed Yellow Peach & Valencia Orange Smoothie Source: Mintel, 2022
Kagome Yasai Seikatsu 100 Mixed Yellow Peach & Valencia Orange Smoothie has been repackaged in a 1,000 gram pack featuring the FSC Mix and Go with Green logos. This sweet and sour drink is made with 14 vegetables or 51% vegetable juice, providing half the recommended daily intake, and five fruits or 48% fruit juice. It is high in dietary fibre and vitamins B2, B12, C and E, and is free from added sugar, added salt, sweeteners, thickeners and preservatives. Launched on October 5, 2021. Recommended retail price not available. Yogurt Drink for Skin Care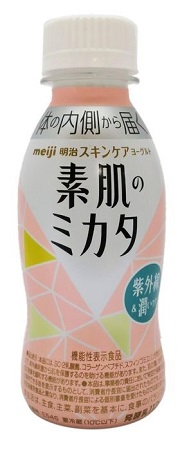 Source: Mintel, 2022
Meiji Suhada No Mikata Yogurt Drink for Skin Care has been relaunched. This FFC-certified drink is formulated with SC-2 lactic acid bacteria, collagen peptides and sphingomyelin to help protect skin against UV rays and retain moisture in skin. The product has a 0.5% milk fat content and retails in a 112 millilire bottle. Launched in September, 2021. Recommended retail price not available. For more informationThe Canadian Trade Commissioner Service: International Trade Commissioners can provide Canadian industry with on-the-ground expertise regarding market potential, current conditions and local business contacts, and are an excellent point of contact for export advice. More agri-food market intelligence:
International agri-food market intelligence
Agri-food market intelligence service More on Canada's agriculture and agri-food sectors:
Canada's agriculture sectors For additional information on FoodEx Japan 2023, please contact:
Ben Berry, Deputy Director Resources
Health and Wellness Series – Functional foods and beverages in Japan Prepared by: Hongli, Wang, Market Analyst © His Majesty the King in Right of Canada, represented by the Minister of Agriculture and Agri-Food (2023).
Photo credits To join our distribution list or to suggest additional report topics or markets, please contact: Agriculture and Agri-Food Canada, Global Analysis1341 Baseline Rd, Tower 5, 3rd floor Ottawa ON K1A 0C5 Canada Email: Esta dirección de correo electrónico está siendo protegida contra los robots de spam. Necesita tener JavaScript habilitado para poder verlo. The Government of Canada has prepared this report based on primary and secondary sources of information. Although every effort has been made to ensure that the information is accurate, Agriculture and Agri-Food Canada (AAFC) assumes no liability for any actions taken based on the information contained herein. Reproduction or redistribution of this document, in whole or in part, must include acknowledgement of agriculture and agri-food Canada as the owner of the copyright in the document, through a reference citing AAFC, the title of the document and the year. Where the reproduction or redistribution includes data from this document, it must also include an acknowledgement of the specific data source(s), as noted in this document. Agriculture and Agri-Food Canada provides this document and other report services to agriculture and food industry clients free of charge. |
Japón | Clientes | Mercados | Estudios de mercado | Intersectorial | Licores - bebidas | Miércoles, 08 Marzo 2023 | ||||||||||||||||||||||||||||||||||||||||||||||||||||||||||||||||||||||||||||||||||||||||||||||||||||||||||||||||||||||||||||||||||||||||||||||||||||||||||||||||||||||||||||||||||||||||||||||||||||||||||||||||||||||||||||||||||||||||||||||||||||||||||||||||||||||||||||||||||||||||||||||||||||||||||||||||||||||||||||||||||||||||||||||||||||||||||||||||||||||||||||||||||||||||||||||||||||||||||||||||||||||||||||||||||||||||||||||||||||||||||||||||||||||||||||||||||||||||||||||||||||||||||||||||||||||||||||||||||||||||||||||||||||||||||||||||||||||||||||||||||||||||||||||||||||||||||||||||||||||||||||||||||||||||||||||||||||||||||||||||||||||||||||||||||||||||||||||||||||||||||||||||||||||||||||||||||||||||||||||||||||||||||||||||||||||||||||||||||||||||||||||||||||||||||||||||||||||||||||||||||||||||||||||||||||||||||||||||||||||||||||||||||||||||||||||||||||||||||||||||||||||||||||||||||||||||||||||||||||||||||||||||||||||||||||||||||||||||||||||||||||||||||||||||||||||||||||||||||||
| Market Overview – Japan | Note: This report includes forecasting data that is based on baseline historical data. Executive summaryThe Japanese economy began to recover from the emergence of the pandemic after a contraction of 4.6% in 2020, as real GDP increased by 1.8% in 2021. During 2022, economic growth is forecast to accelerate, influenced by stronger household consumption, rising capital spending, and accommodative fiscal and monetary policies. The Japanese consumer, particularly younger consumers, intensified their pursuit of healthier eating and food buying habits during the pandemic. Japan is a net importer of agri-food and seafood products. In 2021, Japan's agri-food and seafood trade deficit was US$67.6 billion with imports valued at US$77.4 billion, and exports at US$9.8 billion. Canada was Japan's third largest supplier of agri-food and seafood products with values of US$4.8 billion (6.2% market share) in 2021. Top imports from Canada in 2021 were low erucic acid rape or colza seeds (rapeseed) (US$1,422.5 million, 29.6% market share), fresh or chilled pork (US$983.0 million, 20.5% market share), wheat (US$554.9 million, 11.6% market share), soy beans (US$205.6 million, 4.3% market share) and frozen beef (US$156.6 million, 3.3% market share). The packaged food market in Japan was valued at US$180.3 billion in 2021 and experienced a marginal increase in compound annual growth rate (CAGR) of 1.0% from US$171.5 billion in 2016 (+3.6% from US$173.9 billion in 2019 to US$180.2 billion in 2020) . The market is forecast to increase slightly in CAGR by 1.3% to attain US$192.0 billion by 2026. The health and wellness food and drink product sector in Japan remained stable (unchanged), experiencing 0.0% in CAGR from US$55.2 billion in 2016 to US$55.1 billion in 2021 (−2.6% from US$56.3 billion in 2019 to US$54.8 billion in 2020) and is expected to increase in CAGR by 1.6% to attain US$59.8 billion in 2026. Consumer foodservice in Japan declined in CAGR by 5.1% from retail sales of US$201.8 billion in 2016 to US$155.6 billion in 2021 (−21.4% from US$202.3 billion in 2019 to US$158.9 billion in 2020), however, retail sales are expected to recover by a CAGR of 4.8% to attain US$196.5 billion by 2026. Country profileIncome and expenditureThe Japanese economy began to recover from the emergence of the pandemic after a contraction of 4.6% in 2020, as real GDP increased by 1.8% in 2021. During 2022, economic growth is forecast to accelerate, influenced by stronger household consumption, rising capital spending, and accommodative fiscal and monetary policies. In addition, the Regional Comprehensive Economic Partnership (RCEP) effective January 2022, is also expected to boost Japan's economic development and promote stronger trading relationships between the Association of Southeast Asian Nations (ASEAN) countries and Australia, China, Japan, New Zealand and Korea, through tariff reductions and the simplification of trading rules. In the forecast period (2022-2040), Japan's economy is expected to expand at a compound annual growth rate (CAGR) of 0.7%, in comparison to the average of 4.2% in Asia Pacific (Euromonitor International). Japan's average gross annual income was US$32,581in 2021, ranking third of twenty-two countries in Asia Pacific. Disposable income growth however is set to remain one of the lowest globally from 2021-2040 due to the country's high tax and social security contributions, sluggish wage growth, labour market rigidities which limit productivity growth, and one of the highest global old-age dependency ratios due to a rapidly ageing and declining population (Euromonitor International). DemographicsThe total population of Japan is forecast to attain 125 million in 2022, with baby boomers ( age 55+) occupying roughly 27% of the population segment. The median age of the population is 49.5 years and the single person will account for 37% in comparison to couples with children, who are to account for 24% of household types forecast for 2022. Tokyo is the largest city in Japan representing 30% of the total population in 2022, however the Kanto region is anticipated to remain the largest consumer market in Japan by 2040, accounting for 37.7% of total consumer expenditure (Euromonitor International). Consumer trendsThe Japanese consumer, particularly younger consumers, intensified their pursuit of healthier eating and food buying habits during the pandemic. 25% of Millennials (those aged 15 to 24 years) and 26% of Gen Z (those aged 25 to 39 years) look for healthy ingredients in foods and beverages while 22% of both groups say they closely read nutrition labels. Of note, the government has recently tightened its nutrition label standards to help consumers identify healthy food ingredients. As such, a producer's potential usage of "free from GMO" labelling must now meet stringent requirements and Japanese processed food manufacturers must display the country of origin of their products' primary ingredients on their labels (Euromonitor International). Currently, the number of vegans, vegetarians and flexitarians within the Japanese population remains low. Further, only 12% of millennials (versus 28% of global millennials) reported that they intend to reduce their meat consumption in the future despite the increasing popularity of plant- based foods amongst the consumer (Euromonitor International). The Japanese consumer prefers unique and tailored products and branded goods. They also tend to buy from companies or brands they trust. In relation to cooking habits, 19% of consumers report that they do not have time to cook while 61% reported that they cook or bake every week. In terms of food delivery services, only 8% of Japanese consumers reported using home delivery food services on a weekly basis compared to 37% globally. Many consumers do however, view home food delivery as an integral option for the future, especially within the context of the rapidly ageing population. (Euromonitor International). ProductionRice was Japan's primary domestic crop, with production volumes of 9.7 million tonnes in 2020. The production volume of rice has decreased by a CAGR of −2.9% between 2016 to 2020. Onions and shallots and sugar beet attained the highest CAGR of 10.1% and 5.2% respectively, while rice (paddy), sugar cane and apples also experienced declines in CAGR's of 2.9%, 1.6% and 1.5% respectively, during the same period. Poultry (chickens) were Japan's largest livestock production with 319.7 million chickens in 2020 and a CAGR of 0.8% from 310.1 million in 2016, while swine/pigs (as Japan's second largest livestock production), decreased in CAGR by 0.5% from 9.3 million to 9.1 million during the same period. Poultry was Japan's primary meat, producing 2.3 million tonnes in 2020 and a CAGR of 2.0% from 2.2 million tonnes in 2016. Goat meat production declined in growth by 2.7%, while sheep meat experienced the largest CAGR of 2.6% from 177 tonnes in 2016 to 196 tonnes in 2020.
TradeJapan is a net importer of agri-food and seafood products. In 2021, Japan's agri-food and seafood trade deficit was US$67.6 billion with imports valued at US$77.4 billion, and exports at US$9.8 billion. The United States (U.S) and China were Japan's primary agri-food and seafood suppliers with values of US$16.2 billion (20.9% market share) and US$9.0 billion (11.7% market share) respectively, in 2021. Canada in comparison, was Japan's third largest supplier of agri-food and seafood products with values of US$4.8 billion (6.2% market share) in 2021. Top imports from Canada in 2021 were low erucic acid rape or colza seeds (rapeseed) (US$1,422.5 million, 29.6% market share), fresh or chilled pork (US$983.0 million, 20.5% market share), wheat (US$554.9 million, 11.6% market share), soy beans (US$205.6 million, 4.3% market share) and frozen beef (US$156.6 million, 3.3% market share). Japan's agri-food and seafood imports have increased slightly by a CAGR of 2.1% from US$71.3 billion in 2017. In 2021, top agri-food and seafood imports from the world were corn, chewing tobacco, frozen pork, chicken meat or offal and fresh or chilled beef. Key supplying countries were the United States (U.S) (20.9% market share), China (11.7% market share), Canada (6.2% market share), Thailand (5.7% market share ) and Australia (5.7% market share) in 2021.
Japan's processed food and beverage imports were valued at US$51.9 billion in 2021, with Canada accounting for 4.5% of that market. In 2021, the U.S., China, Thailand, Australia and Canada were the largest suppliers of processed food to Japan accounting for 51.3% of the market. Japan's processed food and beverage imports decreased by 1.2% between 2017 and 2021. In 2021, Japan's top agri-food and seafood exports were food preparations n.e.s., frozen molluscs, prepared sauces, whiskies and bread, pastry, cakes and biscuits. Top export markets were Hong Kong, China, the U.S, Taiwan and Vietnam. Canada was Japan's thirteenth largest export market for agri-food and seafood with values of US$123.6 million (1.3% market share) in 2021.
Canada's performanceCanada exported US$4.2 billion of agri-food and seafood products to Japan in 2021. The top agri-food and seafood suppling Canadian provinces were Alberta (28.0% market share), Saskatchewan (25.5% market share) and Manitoba (19.4% market share). Low erucic acid rape or colza seeds (rapeseed) was the largest commodity exported (US$1.3 billion) with Saskatchewan representing 56.3% of the market share, followed by Alberta and Manitoba representing the remaining shares of 26.8% and 16.6% respectively, in 2021. Fresh or chilled meat of swine (pork) was the second largest commodity exported to Japan with values of US$779.5 million with Manitoba providing 50.9% and Québec providing 25.5% of the market share in 2021.
Retail salesPrior to the onset of the pandemic, packaged food for the Japanese consumer consisted of higher-value products, particularly those within mature product categories, as well as health-conscious (low-carb and high-protein) and convenience (on-the-go consumption) products. As the pandemic progressed and government imposed measures ((working and schooling from home) to restrict virus transmission were implemented, more frozen and easy-to-prepare packaged food products were sought. Relatedly, consumer demand for health and wellness food to strengthen one's immune systems and prevent infection, also increased (Euromonitor International). Further, according to Euromonitor International's Health and Nutrition Survey, over half of Japanese respondents preferred to adopt natural or traditional solutions in the prevention of disease, ranking Japan third in this regard, among all countries that were surveyed. This tendency is reflected in consumers' eating habits and the desire to seek out food for medical purposes rather than taking supplements or medicine. E-commerce, as a popular distribution channel for packaged food during the pandemic, increased in demand. Grocery home delivery providers such as Oisix, experienced increases in the delivery of noodles, frozen packaged food products and meal kits. In addition, supermarkets such as Aeon, increasingly offered more e-commerce options to improve the services and variety of product availability in response to growing consumer demand from home (Euromonitor International). The packaged food market in Japan was valued at US$180.3 billion in 2021 and experienced a marginal increase in compound annual growth rate (CAGR) of 1.0% from US$171.5 billion in 2016 (+3.6% from US$173.9 billion in 2019 to US$180.2 billion in 2020) . The market is forecast to increase slightly in CAGR by 1.3% to attain US$192.0 billion by 2026. The top three packaged food categories in Japan, in terms of largest retail value sales in 2021, were processed meat, seafood and alternatives to meat with values of US$38.8 billion (21.5% market share) increasing at a CAGR of 0.9% from US$37.1 billion in 2016 , followed by baked goods valued at US$23.3 billion (12.9% market share), representing an increase in CAGR of 0.4% from US$22.9 billion in 2016 and meals and soups with values of US$21.1 billion (11.7% market share) and increasing in CAGR by 2.3% from US$18.8 billion in 2016. Of interest, the plant-based dairy category performed well within the historic period as retail sales of the product experienced the largest increase in CAGR (5.8%) as retail sales increased from US$789.5 million in 2016 to US$1.0 billion in 2021. Similarly, processed fruit and vegetables also experienced an increase in CAGR of 5.7% as retail sales grew from US$1.7 billion to US$2.3 billion during the same period. In contrast, baby food experienced a decline in CAGR of 2.0% as retail sales decreased from US$1.0 billion in 2016 to US$909.9 million in 2021. Japan's packaged food market is expected to remain positive in the forecast period, as more consumers continue to work from home post-pandemic and the demand for convenient products with preventative benefits for the health-conscious and ageing population remain (Euromonitor International).
Health and wellnessAccording to Euromonitor International, during 2020 and the onset of the pandemic, health and wellness (HW) packaged food retail sales grew due to increased home consumption while HW beverages retail sales declined due to a decrease in on-the-go consumption outside the home. Further, as the recovery from the pandemic remained largely suppressed because of its continued presence, overall home consumption of HW products were maintained while on-the-go consumption was hampered. Notable health and wellness trends that developed from home seclusion was the shift in consumer value from convenience to affordability, as manufacturers developed larger sized products to accommodate increased home consumption. The consumer's greater awareness and appreciation for healthier products as a result of the pandemic was also reported (Euromonitor International). Retail sales of health and wellness food and beverage products in certain distribution channels, such as convenience stores and vending, were more effected by the pandemic than other channels due to the decrease in the consumer's on-the-go demand as home seclusion was implemented and sustained (Euromonitor International). In comparison, e-commerce as a distribution channel for health and wellness packaged food and beverages, especially niche products, such as organic products, grew and is expected to continue its expansion in the future. Further, store-based retailer shelf space is often limited providing e-commerce the opportunity to offer brands the ability to raise their profile and increase their sales (Euromonitor International). The health and wellness food and drink product sector in Japan remained stable (unchanged), experiencing 0.0% in CAGR from US$55.2 billion in 2016 to US$55.1 billion in 2021 (-2.6% from US$56.3 billion in 2019 to US$54.8 billion in 2020) and is expected to increase in CAGR by 1.6% to attain US$59.8 billion in 2026. Naturally Healthy (NH) was the largest health and wellness category in the historic period with retail sales of US26.3 billion in 2021 and is expected to remain the largest category in the forecast period with retail sales of US$28.5 billion in 2026. Fortified/Functional (FF) was the second largest health and wellness category in the historic period with retail sales of US18.8 billion in 2021 and is expected to remain the second largest category in the forecast period with retail sales of US$20.4 billion by 2026. Of interest, Free From Dairy experienced the largest increase in CAGR in both periods (7.3% and 5.2% respectively/ The health and wellness food and drink product sector is expected to marginally increase throughout the forecast period as workplace consumption occasions remain limited and infrequent and home consumption remains higher. In addition, as the number of marriages and children born significantly decreased in 2020 and 2021, the acceleration of an already aging population is anticipated thus products that support healthy ageing are likely to perform well and increase the demand for health and wellness products in the future (Euromonitor International).
FoodserviceAccording to Euromonitor International, consumer foodservice was one of the industries most impacted in Japan due to the pandemic, and the government imposed restrictions to limit transmission. Independent foodservice types in particular, where more effected than their chained counterparts as many independents lacked the economic foundation to survive the evolving closures and restricted operating hours established during the pandemic (Euromonitor International). In 2021, foodservice types such as bars and pubs struggled due to a reduction in operating hours and an alcohol ban implemented by the government. To assist, the Japanese government responded by providing financial support to struggling foodservice industry members and those wanting to apply new business models, such as takeout, home delivery or food trucks (Euromonitor International). In comparison, limited-service restaurants, especially burger and chicken limited-service restaurants, maintained their predominance due to the continuing demand for takeout and home delivery. Relatedly, full-service restaurants pivoted to offer takeout and home-deliverable menu options and offered smaller food portions with an increased variety or discounted alcoholic drinks to promote in-restaurant solo eating and/or drinking, as states of emergencies lifted. Other full-service restaurants offered experience-focused dining based upon the traditional conveyor belt sushi restaurant design with elements of modern Tokyo pop culture design to attract younger consumers (Euromonitor International). Consumer foodservice in Japan declined in CAGR by 5.1% from retail sales of US$201.8 billion in 2016 to US$155.6 billion in 2021 (-21.4% from US$202.3 billion in 2019 to US$158.9 billion in 2020). In addition, the government also recently accelerated the concept of sustainability through the reduction and recycling of plastic materials by promoting Sustainable Development Goals (SDGs) to become a carbon-neutral society by 2050. Consequently, consumer foodservice types in the growing takeout/home delivery segment are expected to be most affected; however, food waste and sustainable sourcing are being explored by some industry members. For example, Starbucks has begun to discount its food menu before closing to reduce food waste, while sushi full-service player Kura Corp, has established its own fishery company, Kura Osakana Farm, to ensure sustainable sourcing (Euromonitor International). Consumer foodservice retail sales are expected to recover in the forecast period by a CAGR of 4.8% to attain US$196.5 billion by 2026. Euromonitor International notes that the prospects for the Japanese consumer foodservice industry will be positive once the pandemic subsides however; increasing operating costs - the rising costs of ingredients and labour, remain. In response, foodservice industry members are beginning to examine their pricing strategies to incorporate new value added menus while accelerating their digitalization and implementing new technologies such as cashless payments, mobile and tablet ordering to reduce labour reliance within a declining population (Euromonitor International). Full-service and limited-service were the largest foodservice types in the historic period, despite full-service restaurant's recent decline in CAGR, with retail sales of US$67.3 billion respectively in 2021, while cafés and bars experienced the largest declines in CAGR (14.8%) as retail sales decreased from US$41.9 billion in 2016 to US$18.8 billion in 2021 (−42.0% from US$40.4 billion in 2019 to US$23.5billion in 2020). The standalone (freestanding foodservice establishments, not operating in a travel, leisure, lodging or retail location) format was the largest consumer foodservice by location with retail sales of US$125.5 billion (80.7% market share) in 2021, representing a decline in CAGR of 2.4% from US$141.6 billion in 2016 (−11.5% from US$141.6 billion in 2019 to US$125.3 billion in 2020). Euromonitor International notes that strategic store openings will be key to remain present in the standalone market due to evolving consumer habits, especially in terms of work patterns, as teleworking and flexible working hours have become more accepted in Japanese workplaces. Further, rural and urban standalone positioning should consider convenient and unique gourmet foods for rural workers to consume at home or near home while prominent areas that demonstrate presence and exposure to potential customers who frequent urban areas for shopping and entertainment would benefit the standalone format's positioning. Consumer foodservice through lodging (food establishments located in hotels) and travel experienced the largest declines in CAGR's (30.4% and 26.2% respectively) in the historic period (−66.9% and −63.4% respectively from 2019-2020), however these locations are expected to recover by CAGR's of 19.3% and 23.1% respectively, by 2026 as pandemic implemented travel restrictions ease or are removed.
Opportunities for CanadaThe benefits of the Comprehensive and Progressive Agreement for Trans-Pacific Partnership (CPTPP)The CPTPP gives Canadian agriculture and agri-food products preferential market access to key export markets, including Japan. Under the agreement, tariffs will be eliminated or reduced on a wide range of Canadian exports for the agricultural sector, including meat, grains, pulses, maple syrup, wines and spirits, seafood, and other agri-food products. The first six CPTPP parties (Canada, Australia, Japan, Mexico, New Zealand and Singapore) implemented their first tariff cuts on December 30, 2018, eliminating duties on 89% of tariff lines between them, followed by a second tariff cut on January 1, 2019 (except for Japan, which made its second tariff cut on April 1, 2019). Once the agreement is fully implemented, 94% of Canada's exports of agriculture and agri-food products to CPTPP countries will be duty-free. For further information, please consult CPTPP benefits for Canada. Prior to exporting, one of the first steps before entering the market is to determine whether or not a product is authorized for sale in Japan. For example, there could be restrictions due to phytosanitary or food safety related concerns that can prevent a product from being imported. In addition, products must also meet Japanese regulations for food ingredients, especially with regard to food additives. Exporters are therefore strongly encouraged to work with the local import agent, distributor, and the end-user to ensure their products are authorized for sale and are in compliance with Japanese regulations, and that all required documentation has been completed. For more information, please consult Food exports (Canadian Food Inspection Agency) and the Step-by-Step Guide to Exporting (The Canadian Trade Commissioner Service). The CPTPP commits to helping small and medium-sized enterprises (SMEs) take advantage of the agreement's commercial opportunities. SMEs represent over 99% of Canadian businesses and almost 90% of all private sector jobs in Canada. For further information, please consult CPTPP benefits for small and medium-sized enterprises. Of note, funding and support programs, such as CanExport SMEs, are available to interested Canadian SMEs to assist with international market development activities. If you interested in exporting and have questions about exporting your agriculture or food products, or are looking for support, please contact the Market Access Secretariat, Agri-food and Agriculture Canada at Esta dirección de correo electrónico está siendo protegida contra los robots de spam. Necesita tener JavaScript habilitado para poder verlo.. For more informationThe Canadian Trade Commissioner Service: International Trade Commissioners can provide Canadian industry with on-the-ground expertise regarding market potential, current conditions and local business contacts, and are an excellent point of contact for export advice. More agri-food market intelligence:
International agri-food market intelligence
Agri-food market intelligence service More on Canada's agriculture and agri-food sectors:
Canada's agriculture sectors For additional information on FoodEx Japan, please contact:
Ben Berry, Deputy Director Resources
Market Overview – Japan Prepared by: Laurie Bernardi, International Market Research Analyst © His Majesty the King in Right of Canada, represented by the Minister of Agriculture and Agri-Food (2023).
Photo credits To join our distribution list or to suggest additional report topics or markets, please contact: Agriculture and Agri-Food Canada, Global Analysis1341 Baseline Rd, Tower 5, 3rd floor Ottawa ON K1A 0C5 Canada Email: Esta dirección de correo electrónico está siendo protegida contra los robots de spam. Necesita tener JavaScript habilitado para poder verlo. The Government of Canada has prepared this report based on primary and secondary sources of information. Although every effort has been made to ensure that the information is accurate, Agriculture and Agri-Food Canada (AAFC) assumes no liability for any actions taken based on the information contained herein. Reproduction or redistribution of this document, in whole or in part, must include acknowledgement of agriculture and agri-food Canada as the owner of the copyright in the document, through a reference citing AAFC, the title of the document and the year. Where the reproduction or redistribution includes data from this document, it must also include an acknowledgement of the specific data source(s), as noted in this document. Agriculture and Agri-Food Canada provides this document and other report services to agriculture and food industry clients free of charge. |
Japón | Estudios de mercado | Mercados | Intersectorial | Miércoles, 08 Marzo 2023 | ||||||||||||||||||||||||||||||||||||||||||||||||||||||||||||||||||||||||||||||||||||||||||||||||||||||||||||||||||||||||||||||||||||||||||||||||||||||||||||||||||||||||||||||||||||||||||||||||||||||||||||||||||||||||||||||||||||||||||||||||||||||||||||||||||||||||||||||||||||||||||||||||||||||||||||||||||||||||||||||||||||||||||||||||||||||||||||||||||||||||||||||||||||||||||||||||||||||||||||||||||||||||||||||||||||||||||||||||||||||||||||||||||||||||||||||||||||||||||||||||||||||||||||||||||||||||||||||||||||||||||||||||||||||||||||||||||||||||||||||||||||||||||||||||||||||||||||||||||||||||||||||||||||||||||||||||||||||||||||||||||||||||||||||||||||||||||||||||||||||||||||||||||||||||||||||||||||||||||||||||||||||||||||||||||||||||||||||||||||||||||||||||||||||||||||||||||||||||||||||||||||||||||||||||||||||||||||||||||||||||||||||||||||||||||||||||||||||||||||||||||||||||||||||||||||||||||||||||||||||||||||||||||||||||||||||||||||||||||||||||||||||||||||||||||||||||||||||||||||
| Sector Trend Analysis – Health and wellness – Packaged food and beverage trends in Mexico | Note: This report includes forecasting data that is based on baseline historical data. Executive summaryKey health and wellness (HW) trends across the world include keeping bellies and wallets full with satiating, nutritious food and drink; arming consumers with the know-how they need to adapt their meal plans using new alternative ingredients; giving overwhelmed consumers the freedom to indulge, to treat themselves and to help them optimize their mental performance at work, home and play; also, invigorating consumers with new experiences that helps them thrive in extreme environmental conditions by invoking food and drink more as a source of optimism, innovation and connection (Mintel: Global food & drink Trends, 2023). In Mexico, the new labelling regulation (NOM051) introduced on packaging for food and drink products that have high levels in sugar, salt and fats content, which came into effect towards the end of 2020, has served to bolster consumer concerns and resulted in a continuation of HW trends in 2021. Lower and middle-income Mexicans continued to prioritize fortified foods & beverages in the interest of receiving maximum value from economy brands in the face of continued economic stress brought on by the pandemic (Euromonitor: Health & Wellness in Mexico, 2022). In 2021, retail sales of the Mexican HW sector totaled US$18.1 billion. Of this total, 64% accounted for HW retail food sales at US$11.6 billion with the remainder 36% in HW retail beverage products at US$6.5 billion. The HW category with the highest retail sales value was for fortified/functional (FF) food and drink products at US$10.5 billion, followed by better for you (BFY) at US$3.9 billion and naturally healthy (NH) at US$2.3 billion in 2021. Free from food products and organic food and drink products are becoming more popular amongst Mexicans with registered sales and a compound annual growth rate (CAGR) between 2016 and 2021 of US$1.3 billion (13.1%) and US$63 billion (12.0%), respectively. According to a Mintel Global survey consisting of 1,000 responses (2022), 59% of Mexicans indicated that they look to consume more nutritious food/drink products packed with vitamins and minerals. Although, competitive pricing is a key consideration when introducing high premium quality products to the market, consumers are looking for 'value-added' products that deliver in forms beyond low cost. 2023 – Global and Mexican food and drink trendsConsumers across the world are looking for reassurance as they continue to be challenged to adapt, with feelings of insecurity and uncertainty surrounded around increasing fluctuations in cost-of-living finances, such as food and drink products. Manufacturers are also, facing these same challenges and are trying to adjust alongside the anxious, value-conscious consumer by continuing to diversify and innovate their brand offerings that offer measurable tangible benefits from what they invest in terms of quality, premium, convenient and budget-friendly products. Consumers are looking for 'value-added' products that go beyond affordable, low prices, where they want satiating, yet nutritious food and drink, while also having the freedom to indulge in new experiences, including the choice between versatile options that help optimize one's health and well-being throughout all life occasions.Footnote 1 To better connect with overwhelmed, fatigued consumers, on-pack product communication should be streamlined to focus on a few specific key health claim benefits in order to remain as a more trustworthy brand. Amongst, the countries with the highest inflation in mid-2022 (including Brazil, Canada, Italy, South Korea), key health claims such as immune support, healthy heart or digestive health benefits and the usage of natural health-boosting ingredients over fortified ones are factors that are often more important than low price offerings. In a Mintel Global Consumer survey, 59% of Mexicans (over 1,000 users) indicated that they look to consume more nutritious food/drink products packed with vitamins and minerals over seeking more affordable options (23%).Footnote 1 'Better-for-us' will become the new 'better-for-you' for ethical consumers that expect that health products considered for 'luxury' should not be restricted to those with high disposable incomes. Food insecurities and exposed inequalities across global and local food systems have only heightened during the pandemic, forcing a shift toward community-led solutions - and moving away from power monopolies that have driven food systems in the past. Manufacturers are forced to address sustainable issues beyond storage and processing factors; to also, protect the factors that impact the nutritional value of food from farm to table by devoting resources to improve soil health, growing conditions (water stewardship, CO2 levels, pollution), crop genetics, post-harvest nutrient degradation and climate change - to name a few.Footnote 1 Consumers are still cooking at home frequently, but more recently, rising food costs due to inflation, export/food supply issues and the looming threat of a global recession have put more pressure on consumers' abilities to obtain, prepare and maximize their groceries. Brands will need to help consumers become more flexible in the kitchen, both to optimize the usage of alternative, cheaper ingredients and to find new ways to cook with them. Brands have the opportunity to help consumers gain confidence and put them in control when practicing flexibility, by arming them with the 'know how' guidance and support, while offering versatile ways to incorporate new ingredients and transforming traditional recipes in new ways. Now more important than it was pre-pandemic, brands can enhance the experience of at-home consumption, by building food and drink into self-care regimens, and transforming the experience from a guilty pleasure to a necessary coping mechanism - whereby lower than global average, 22% of 1,000 Mexican respondents indicated that they like to relieve stress by eating comforting foods and 27% like to pamper themselves (that is, taking relaxing baths/showers, in-home facials).Footnote 1 Health and wellness sector – market overviewOverall, the HW Mexican sector reached a retail sales value of US$18.1 billion in 2021, which has increased at a CAGR of 6.5% (2016-2021) and a forecast CAGR of 6.4% (2021-2026). A total of 64% were HW packaged food products at a sales value of US$11.6 billion, with the FF category representing the highest market share at 66.3%, followed by BFY (11.7%), free from (11.3%), NH (10.5%) and organic (0.3%) in 2021. The remainder 36% of HW non-alcoholic beverages reached sales of US$6.5 billion, which are thriving the most from within the FF (43.6%), BFY (39.4%), NH (16.7%), and organic ( 0.3%) related drink categories in 2021.
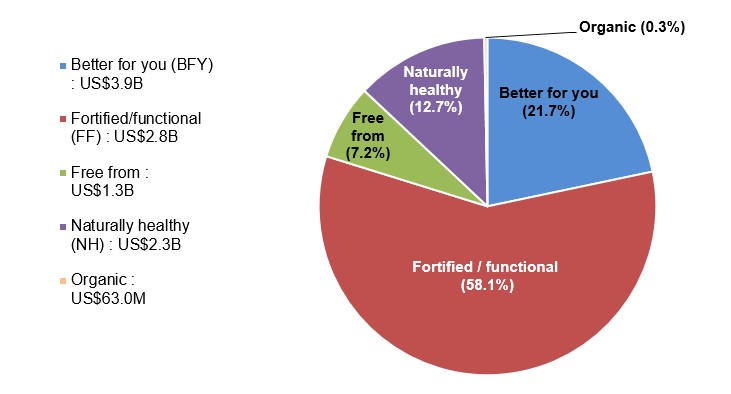
Description of above image
Source: Euromonitor, 2022 Health and wellness packaged food products
Health and wellness beverages productsNon-alcoholic HW beverages fall under both hot drink (coffee, tea, other) and soft drink categories such carbonates, energy/sport drinks, fruit or vegetable juices or powders concentrations, functional drinks, iced/ready-to-drink (RTD) coffee or tea drinks, enhanced/flavored bottled water combinations, and Asian specialty drinks.
Competitive analysis – Health and wellness packaged food and beveragesIn 2021, Coca Cola with a Mexican market share of 10.5% and Nestlé SA (9%) were set to see share growth in the HW space as they tapped into a great consumer demand for reduced-calorie and naturally healthy products. Coca-Cola leads in HW beverages with its Coca-Cola Sin Azúcar (Zero Sugar) continuing to make strong gains during the year, which is a brand targeted by the company to provide healthier options and actively tries to redirect consumers from regular Coca-Cola (whose price is also elevated by added taxes). Meanwhile, the Mexican multinational, Grupo Bimbo with a market share of 13.7% in 2021, leads in the HW packaged food segment with its national coverage, well-positioned brands, and efficient distribution network.Footnote 2 "Back to local" is an important trend, which is increasing in visibility and gaining some traction in Mexico. Many coffee brands are looking to promote organic products to support the local coffee industry. During the year, the rationalization strategy implemented in 2020 by many companies has been replaced by products launched with consumers' willingness-to-pay in mind. Motivation for the move towards new product development was further strengthened by the implementation of the new labelling regulation - requiring companies to place black octagonal seals on products that contain excess of sugar, calories, sodium, or fat.Footnote 2
Better for you – packaged food and beverage categoryTo qualify for inclusion in the BFY product category, the 'less healthy' element of foodstuff needs to have been actively removed or substituted during the processing stage. Products most likely to be included in this BFY positioning/marketing claim will be those which are low-fat or low-sugar versions of standard products (that is, reduced fat mayonnaise/cheese/milk or reduced sugar confectionery etc). NH drinks contain categories of packaged/flavored/enhanced water, fruit powders, juices and nectars. Market sizes: Better for youIn Mexico, better for you (BFY) packaged food (US$1.3 billion) and drink (US$2.6 billion) products reached a retail sales value of US$3.9 billion in 2021. The BFY - reduced fat in the food category had the largest sales (mostly dairy) at US$749.8 million, followed by BFY - reduced salt (butter and spreads) at US$403.7 million, and BFY - reduced/no sugar products at US$195.5 million (mostly confectionery) in 2021. BFY sub-categories with the highest CAGRs (2016-2021) were reduced fat sauces, dressings and condiments (12.2%) and ice cream (11.4%), along with reduced sugar yogurt (21%) and spreads, excluding honey (11.5%).
Competitive landscape – better for youLeading packaged food companies in Mexico and top brands in the BFY category in 2021, include Nestlé SA (Sveltesse, Carnation) at a market share of 18.4% (US$248.4 million), Cremería Americana SA de CV (Gloria, La Abuelita) at 12.4% (US$166.7 million), and Ganaderos Productores de Leche Pura SA de CV (Alpura) at 10.2% (US$137.9 million). The Coca-Cola company (top brands: Coke, Ciel, Sprite) dominates within the BFY beverage category at a market share of 45.5% (US$1.2 billion), followed by Le Groupe Danone (Levité) at 24.3% (US$623.8 million), and PepsiCo Inc. (Pepsi Max, Be-Light, H2OH!, 7Up) at 9.7% (US$249.8 million) in 2021.
Product launch analysis – better for youAccording to Mintel, there were approximately 6,599 new BFY food products launched (including new variety/range extension, packaging, formulation or relaunched) within Mexico between January 2017 and December 2022. These minus food products contained claims such as low/no/reduced (saturated or trans) fat; low/no/reduced calories, cholesterol, sodium, carbs, glycemic; no added sugar or sugar free; diet/light and not pasteurized. During this same period there were 1,605 minus 'BFY' related drink products launched in the Mexican market. 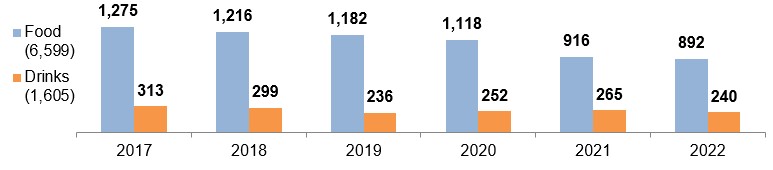
Description of above image
Source: Mintel, 2022 Total item count: 8,204 Top sub-categories (brands) within the BFY food category with new product launches in Mexico (2017 to 2022) were sweet biscuits/cookies (Sweetwell), white milk (Lala Deslactosada/Lala 100), corn-based snacks (Doritos Nacho), potato snacks (Sabritas) and flavoured milk (Lala Yomi/Lala 100).
Between January 2017 and December 2022, among a sample size of 1,605 new products, top brands launched within the BFY non-alcoholic drink category were Coca-Cola (Sin Azúcar/Light), Tang, Bonafont Kids, V8 Splash and Great Value. 
Description of above image
Source: Mintel, 2022 Total item count: 1,605 Popular claims associated with BFY food and beverage new product launches over the last six-year period were low/no/reduced allergen or fat, free from or no additives/artificial preservatives, Kosher, gluten free, vitamin/mineral plus, low/no/reduced calorie, no added sugar, and low/no/reduced transfat. 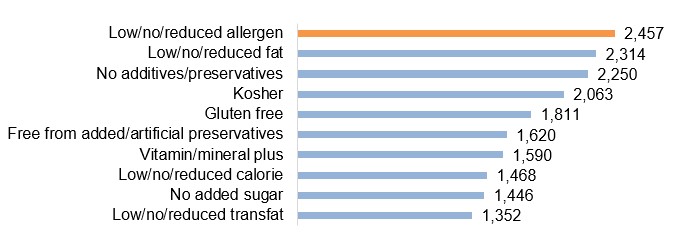
Description of above image
Source: Mintel, 2022 Total item count: 8,204 Product examples – better for youStrawberry Pie Donuts Source: Mintel, 2022
This product retails in a 120 gram pack containing two units. Contains excess amounts of saturated fat, and contains sweeteners according to the Mexican Health Secretariat. High in proteins. Baked artisan donut filled with cream cheese and natural strawberry jam. With added protein and monk fruit sweetener. Healthy snack with 11.7 grams of proteins - 4.7 gram of net carbs. Reduced total fat and calories comparing to similar products. Suitable for controlled diabetics and non-coeliac gluten intolerance. Adobo Hot Flavored Potato Chips Source: Mintel, 2022
This new product retails in a 141.75 gram pack. It is high in calories and sodium, according to the Secretariat of Health for Mexico- Naturally gluten-free - 0% trans fats. Also, available in cheddar and sour cream, sour cream and onion, and classic or wavy original flavoured potato chips. Rainbow Unicorn Flavored Energy Drink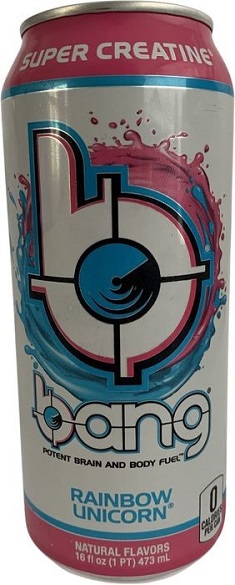 Source: Mintel, 2022
This new product retails in a 473 millilitres pack. Contains super creatine - Ultra CoQ10- EAA amino acids, natural flavors and stable aqueous amide-protected bioactive creatine species. Powers one up- by the makers of the legendary Redline Energy products. Potent brain and body fuel, with super creatine, caffeine. Zero carbohydrates, sugar, calories and artificial colors. Fortified / functional – packaged food and beverage categoriesWhen identifying FF products, focus is on products to which health ingredients or/and nutrients have been added, as well as, brands that are positioned to deliver certain functionality. To be included here the enhancement has to be highlighted in the label or hold a health/nutritional claim. FF food and beverages provide health benefits beyond their nutritional value and/or the level of added ingredients wouldn't normally be found in that product and merits inclusion only when the product was actively fortified/enhanced during production. For example healthy products such as 100% fruit/vegetable juices are only added under FF, if additional health ingredients have been added like calcium, omega-3 etc. Market sizes – fortified / functionalIn Mexico, FF packaged food (US$7.7 billion) & drink (US$2.8 billion) products reached a retail sales value of US$10.5 billion in 2021. The largest sales occurred in the FF soft drink category at US$2.6 billion, followed by FF dairy at US$2.3 billion, and FF bread at US$1.6 billion in 2021. All FF food and drink products registered moderate growth between 2016 and 2021. Categories with the highest CAGRs (between 6-7%) during this period were FF sport drinks, FF bread, FF sweet biscuits, FF snack bars, and FF dairy. FF energy drinks (10%), FF sports drinks (7.9%), and FF milk baby formula (7.9%) are expected to grow the most between the forecast period (2021-2026).
Competitive landscape – fortified / functionalLeading packaged food companies in Mexico and top brands in the FF category in 2021, include Grupo Bimbo SAB de CV (Bimbo, Marinela, Tía Rosa) at a market share of 30.3% (US$2.3 billion), Nestlé SA (Nido, Nan, Gerber) at 10.7% (US$820.8 million), and The Kellogg Company (Zucaritas, Choco Krispies, Corn Flakes) at 8.8% (US$676.9 million). Private labels accounted for a sales share of 0.9% (US$71.5 million) in 2021. In 2021, leading FF beverage companies (top brands) in Mexico included The Coca-Cola company (Powerade, Burn, Ciel) at a 15.5% market share (US$441.1 million), followed by Grupo Nutresa SA (Zuko) at 10.8% (US$307.5 million), and Modelez International Inc. (Tang, Clight) at 10.7% (US$303.9 million).
Product launch analysis – fortified / functionalAccording to Mintel, there were approximately 5,502 new fortified / functional food products launched (including new variety/range extension, packaging, formulation or relaunched) within Mexico between January 2017 and December 2022. These products contained either fortified (food plus) claims (added calcium, high/added fiber or protein, stanols/sterols, vitamin/mineral fortified) or functional claims (antioxidant, functional: bone health, brain & nervous system, cardiovascular, digestive, energy, eye health, immune system, other; slimming, stress and sleep, weight and muscle gain, high satiety, prebiotic, probiotic). During this same period there were 1,748 fortified / functional related drink products launched in the Mexican market. 
Description of above image
Source: Mintel, 2022 Total item count: 7,250 According to new product launches in Mexico (2017 to 2022), top sub-categories (brands) within the FF food category were cold cereals (Kellogg's - Zucaritas/Choco Krispis), white milk (Lala), snack/cereal/ energy bars (Berry Nuts), sweet cookies & biscuits (Garmesa Marias) and pasta (La Moderna).
Between January 2017 and December 2022, among a sample size of 1,748 new products, top brands launched within the FF non-alcoholic drink category were Tang (Sin Azúcar/Light), Zuko, Powerade ION4, Nestlé Nesquick, and Great Value. 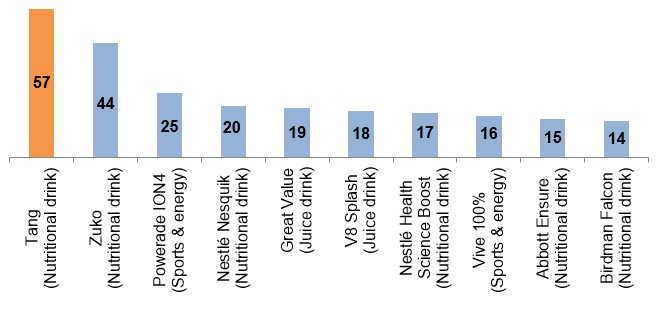
Description of above image
Source: Mintel, 2022 Total item count: 1,748 Popular claims associated with FF food and beverage new product launches over the last six-year period were vitamin/mineral fortified, Kosher, low/no/reduced allergen/fat/lactose, no additives/preservatives, gluten free, high/added protein, functional - energy, and antioxidant. 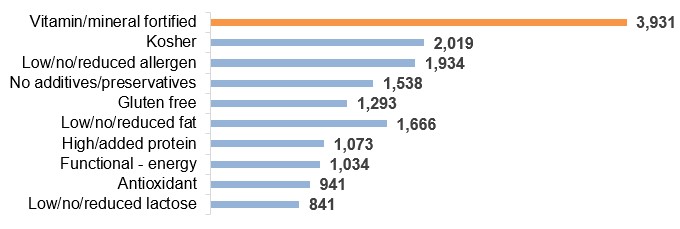
Description of above image
Source: Mintel, 2022 Total item count: 7,250 Product examples – fortified / functionalCheddar & Mozza Style Blend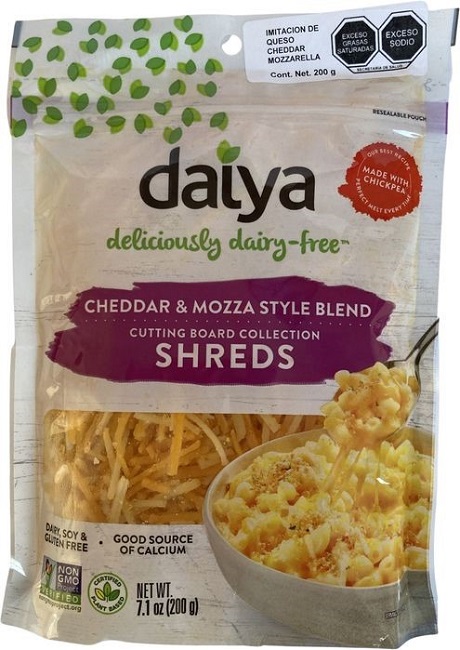 Source: Mintel, 2022
This product is now available, and retails in a 200 gram pack. Deliciously dairy-free. Cutting board collection shreds, made with chickpea. Free from soy, gluten, GMO and peanuts. Good source of calcium. Plant based. Contains excess amounts of saturated fats and sodium, according to the Secretariat of Health of Mexico. Resealable pouch and is a freezable, Vegan product. Logos and certifications: Certified plant based, certified gluten free, non-GMO; Project verified: Halal, Kosher. Avocado Almond Milk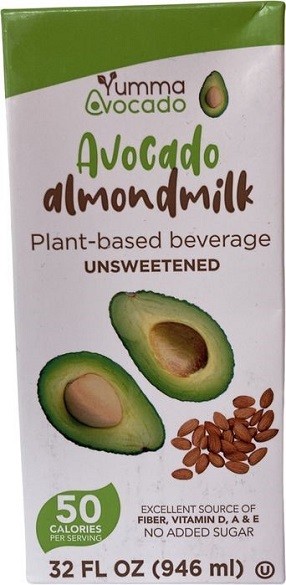 Source: Mintel, 2022
This unsweetened plant-based beverage is made with premium Hass avocados, is an excellent source of fibre, and vitamins D, A and E, and contains 50 calories per serving. It is kosher-certified, vegetarian and free from added sugar, dairy, gluten and soy. This product retails in a recyclable 946 millilitre pack, bearing the FSC Mix logo. Free from – packaged food and beverage categoriesThe free from category includes product claims such as free from gluten, lactose, allergens, dairy and free from meat. This excludes foods which are certified 'free' of a specific product, when this is based on use of sterilised equipment. Market sizes – Free fromThe free from market has became more popular in Mexico, which grew at a CAGR of 13.1% (2016-2021) with a packaged food retail sales value of US$1.3 billion in 2021. The largest category in the free from food sector was within the free from lactose category with sales at US$845.5 million, consisting of sub-categories such as 'free from lactose - dairy' (US$735.8 million) and the 'free from lactose - baby food' (US$109.6 million). There were no free from drink products reported in Euromonitor within the Mexican market. The free from allergens - HA milk formula category had the highest historical growth at a CAGR of 16.2% (2016-2021) and is expected to continue to grow the most at a CAGR of 11.5% (2021-2026).
Competitive landscape – free fromLeading packaged food companies (top brands) in Mexico in the 'free from' category in 2021, include Grupo Lala SAB de CV (Lala, Vita Lala, Borden) at a market share of 19.7% (US$257.0 million), Ganaderos Productores de Leche Pura SA de CV (Alpura) at 17.2% (US$224.3 million), and Nestlé SA (Nido, Nan, Nestlé) at 12.4% (US$162.0 million).
Product launch analysis – free fromAccording to Mintel, there were approximately 1,343 new free from food products launched (including new variety/range extension, packaging, formulation or relaunched), within Mexico between January 2017 and December 2022. These products contained free from ingredient claims such as caffeine, dairy, hormone or palm oil free. During this same period, there were 376 free from drink products launched. 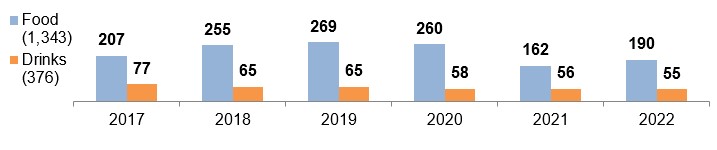
Description of above image
Source: Mintel, 2022 Total item count: 1,719 According to new product launches in Mexico (2017 to 2022), top sub-categories (brands) within the free from food category were poultry products (Pilgrim's), white milk (Lala - Deslactosada/Light/100/Orgánica), sweet biscuits/cookies (Sweetwell), snack/cereal/energy bars (Nature's Bakery) and plant based drinks or dairy alternatives (Nature's Heart).
Between January 2017 and December 2022, among a sample size of 376 new free from hot beverage products, top brands launched within the free from non-alcoholic drink category were The London Fruit & Herb Company, Therbal, Yogi, Lifestyle Awareness, and Celestial Seasonings. 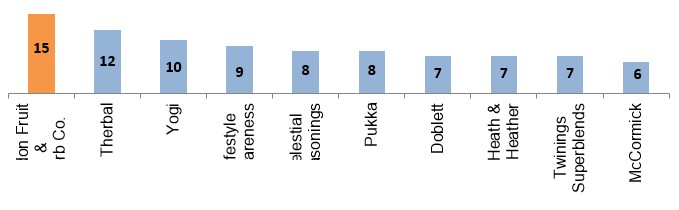
Description of above image
Source: Mintel, 2022 Total item count: 376 Popular claims associated with 'food minus' food & beverage new product launches over the last six-year period were low/no/reduced allergen, gluten free, hormone free, Kosher, dairy free, no additives/ preservatives, GMO free, vegan/no animal ingredients, caffeine free, and organic. 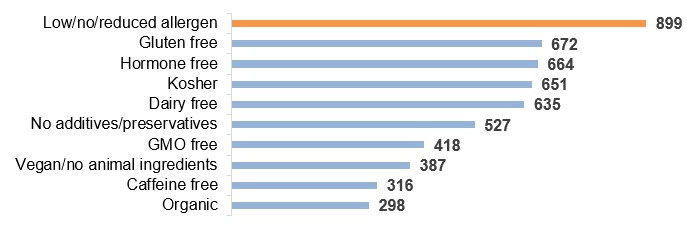
Description of above image
Source: Mintel, 2022 Total item count: 1,719 Product examples – free fromGluten Free Meatless Pepperoni Style Pizza Source: Mintel, 2022
This product has been reformulated with and a new and improved recipe featuring premium cutting board cheeze shreds. This plant based product is made with gourmet ingredients, and is free from GMOs, dairy, gluten and soy. This vegan pizza is a good source of fiber, and contains saturated fat and sodium excess according to the Mexican Health Secretary. It retails in a recyclable 16.7 ounce pack featuring baking instructions. Double Chocolate Quinoa Cookies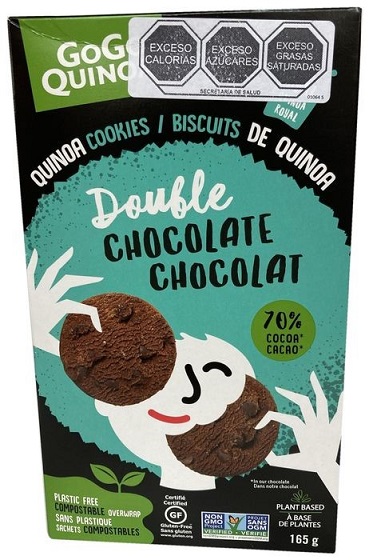 Source: Mintel, 2022
This product has been repackaged with an updated design. These plant-based cookies, according to the Secretariat of Health for Mexico, are high in calories, sugars and saturated fats. They have been made using 70% cocoa, and comprise of natural ingredients, including: royal quinoa flour, which has been harvested in the Bolivian highlands; chia seeds, which are rich in protein and fiber; and kiwicha, a small crunchy seed with a full-bodied nuttiness. These cookies are free from eggs, milk, corn, soy, nuts and peanuts, have been kosher certified and made using RSPO certified palm oil. They retail in a recyclable 165 gram pack, itself made from 100% recycled fibres and features the Certified Gluten-Free and Non GMO Project Verified logos. The pack also features a plastic-free and compostable overwrap in accordance with the manufacturer's aim to reduce plastic consumption by 2021. Also, available in chocolate chip variety. Dairy-Free Half & Half Alternative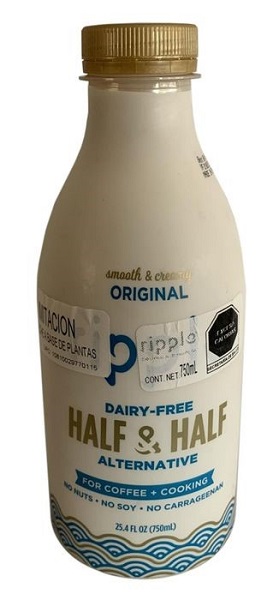 Source: Mintel, 2022
The original, plant-based product is said to be smooth and creamy, and contains no nuts, GMO, gluten, lactose, soy or carrageenan, saturated fat or cholesterol. It can be used for coffee or cooking, is claimed to be nutritious and delicious, and is made with 100% vegan pea protein. This kosher-certified product retails in a recyclable 750 millilitre pack, bearing the Certified B Corporation logo, and an excess of calories warning by the Mexican Health Secretariat. Naturally healthy – packaged food and beverage categoriesThe NH category includes food and beverages on the basis of naturally containing a substance that improves health and wellbeing beyond the product's pure calorific value and are usually a healthier alternative within a certain sector/subsector. Examples include high fibre food (wholegrain/wholemeal/ brown) soy products, sour milk drinks, nuts, seeds and trail mixes, honey, fruit & nut bars, and olive oil; along with NH beverages such as 100% fruit/vegetable juice, superfruit juice, natural mineral/spring water, RTD green tea etc. Noting that NH food and beverages that are additionally fortified fall into the FF category. Market sizes: naturally healthyIn Mexico, NH packaged food (US$1.2 billion) and NH drink (US$1.1 billion) products reached a retail sales value of US$2.3 billion in 2021. The largest sales occurred in the NH soft drink category such as bottled water and fruit/vegetable juices at US$975.5 million, followed by staples like NH nuts, seeds & trail mixes at US$558.1 million, NH - high fibre breakfast cereals at US$190.7 million, NH olive oil at US$137.7 million, and NH honey at US$127.1 million in 2021. The NH segment benefited from the ongoing shift towards a more holistic and preventative approach to health & wellness, which is highly related with rising consumer concerns about the long-term consumption of artificial additives and an interest in natural ingredients.Footnote 2 All NH food and drink products registered moderate growth between 2016 and 2021 at a total CAGR of 7.4%. Categories with the highest growth during this period were NH rice (11.4%), NH - high fibre pasta (9.5%), NH hot tea drinks (9.3%), NH fruit snacks (9%), and NH honey (9%). NH cereal bars (12.9%), NH olive oil (9.4%), and NH rice (9.2%) products are expected to grow the most over the forecast period (2021-2026).
Competitive landscape – naturally healthyLeading packaged food companies (top brands) in Mexico in the NH category in 2021, include PepsiCo Inc. (Lay's, Barras - Quaker, Mafer) at a market share of 33.1% (US$401.0 million), Grupo Bimbo SAB de CV (Barcel, Hot Nuts) at 12.6% (US$153.0 million), and Deoleo SA (Carbonell, Carapelli, Arroz SOS) at 4% (US$48.1 million). Private labels accounted for a sales share of 15.9% (US$192.7 million) in sales value in 2021. In 2021, leading NH beverage companies (top brands) in Mexico included Nestlé SA (Santa María, S Pellegrino) at a 16.8% market share (US$182.1 million), followed by Grupo Jumex SA de CV (Jumex, Bida) at 15.1% (US$164.0 million), and Keurig Dr Pepper Inc. (Peñafiel, Aguafiel) at 12.7% (US$138.5 million). Private label NH beverages represented 0.3% (US$3.3 million) in sales in Mexico over the year.
Product launch analysis – naturally healthyAccording to Mintel, there were approximately 8,043 new natural food products launched (including new variety/range extension, packaging, formulation or relaunched), within Mexico between January 2017 and December 2022. These claims were either an 'all natural', GMO free, no artificial additives (colourings, flavourings) and preservatives, organic or wholegrain products. During this same period there were 1,326 naturally healthy related drink products launched. 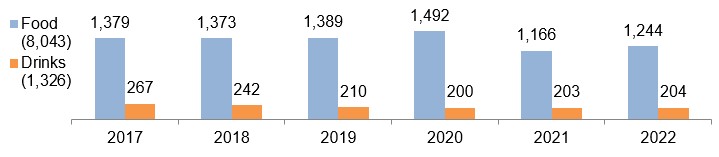
Description of above image
Source: Mintel, 2022 Total item count: 9,369 According to new product launches in Mexico (2017 to 2022), top sub-categories (brands) within the NH food category were cold cereals (Nestlé Cheerios), both sweet biscuits/cookies and snack/cereal/energy bars (Quaker), vegetables (La Costeña), and seasonings (Esquina González).
Between January 2017 and December 2022, among a sample size of 1,326 new products, top brands launched within the NH drink category were Jumex, Bonafont Kids, Del Valle, Therbal, and Campo Vivo. 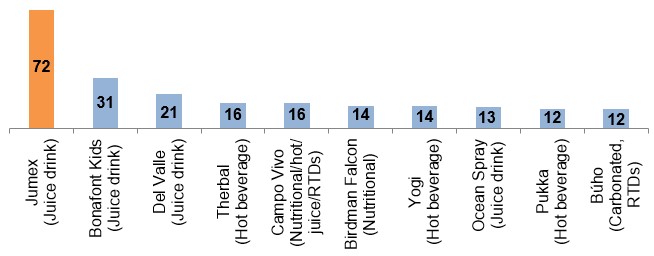
Description of above image
Source: Mintel, 2022 Total item count: 1,326 Popular claims associated with NH food & beverage new product launches over the last six-year period were no additives/preservatives, free from added artificial preservatives/colourings/flavourings, Kosher, low/no/reduced allergen, gluten free, all natural product, GMO free, and wholegrain. 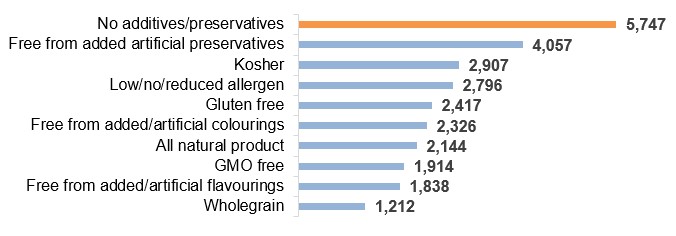
Description of above image
Source: Mintel, 2022 Total item count: 9,369 Product examples – naturally healthyTzatziki and Dill Dip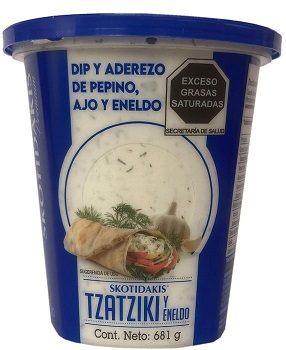 Source: Mintel, 2022
This product has been repackaged with an updated design. This kosher certified product is described both a dip and dressing and, according to the Secretariat of Health for Mexico, is high in saturated fats. It has been made using all natural ingredients and retails in a 681 gram pack. Total Oat Source: Mintel, 2022
This product has been repackaged and now retails in a newly designed 400 gram pack featuring preparation instructions. The product is a source of fiber, is described as 100% natural wholegrain oat flakes, and contains no seals or legends, according to the Secretariat of Health of Mexico. Blueberry Herbal Tea Source: Mintel, 2022
This product retails in a 34 gram pack containing 20 1.7 gram units within freshness sealed tea bags. 100% natural herbal tea. Non-chlorine bleached white filter paper. Can be enjoyed hot or iced. Pack bearing usage directions. Logos and certifications: Kosher. Organic – packaged food and beverage categoriesOrganic products are often associated with 'free-from' or 'all natural' attribute claims, including fat-free/extra lean or salt/sodium-free or 'no added' ingredients that are known to be considered as being unhealthy. Beverages within the organic category only include juice types that usually consist of all natural ingredients. Opportunity exists in Mexico to develop claims such as organic, and interest in natural products is high across all sectors, making it an important consideration for new product development. Market sizes – OrganicAs consumers have become increasingly concerned about the production processes, as well as more aware about the presence of artificial chemicals in products, the organic market has become more trusted in Mexico growing at a CAGR of 12% (2016-2021), registering organic packaged food (US$40.2 million) and drink (US$22.8 million) combined retail sales value of US$63.0 million in 2021. With the demand for organic products also supported by rising environmental consciousness, organic products looked set to see notable growth in coffee, juices, and baby food in 2021.Footnote 2 The largest category in the organic sector was within the hot drink - organic coffee category with sales at US$19.6 million, followed by organic spreads (US$16.1 million) and organic ready meals (US$6.9 million). Between 2016 and 2021, the highest growing organic categories were dairy (24.1%), baby food (19.3%), sauces, dressings and condiments (14.9%), and ready meals (13.3%). Categories forecast (2021-2026) to grow the most are organic dairy (17.6%), organic baby food (12.5%), and organic rice, pasta & noodles (12.5%) products.
Competitive landscape – organicLeading organic packaged food companies (brand) in Mexico 2021, include Grupo Herdez SAB de CV (Aires de Campo) at a market share of 28.8% (US$11.6 million), Grupo Industrial Cuadritos Biotek, SA de CV (Bové) at 9.4% (US$3.8 million), and Nestlé SA (Gerber) at 8.7% (US$3.5 million). Private labels accounted for a sales share of 5.6% (US$2.3 million) in sales value in 2021. Leading organic beverage companies (top brands) in Mexico included Grupo Herdez SAB de CV (Aires de Campo, Blasón) at a market share of 24.5% (US$5.6 million), followed by Santa Cruz Natural Inc. (Santa Cruz) at 4.5% (US$1.0 million), and Nestlé SA (Taster's Choice) at 0.7% (US$0.2 million) in 2021. Private label organic beverages held a market share of 9.3% (US$2.1 million) in sales in Mexico over the year.
Product launch analysis – organicAccording to Mintel, there were approximately 1,421 new organic food products launched (including new variety/range extension, packaging, formulation or relaunched), within Mexico between January 2017 and December 2022. During this same period there were 408 organic drink products launched in Mexico. 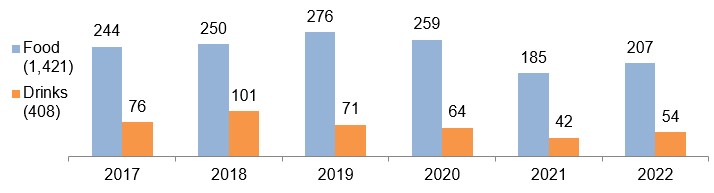
Description of above image
Source: Mintel, 2022 Total item count: 1,829 According to new product launches in Mexico (2017 to 2022), top sub-categories (brands) within the organic food category were seasonings (Esquina González), snack/cereal/energy bars and cold cereals (Eat Natural Lima Limón), baking ingredients (Tía Ofilia) and pasta (Castagno Orgánico).
Between January 2017 and December 2022, among a sample size of 408 new products, top brands launched within the organic drink category were Campo Vivo, Birdman Falcon, Yogi, Pukka, and Heath & Heather. 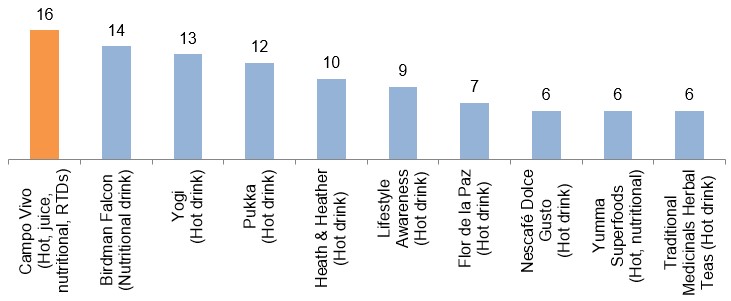
Description of above image
Source: Mintel, 2022 Total item count: 408 Popular claims associated with organic food & beverage new product launches over the last 6-year period were organic, GMO free, Kosher, low/no/reduced allergen, gluten free, no additives/preservatives, vegan/no animal ingredients, free from added artificial colourings, all natural product and no added sugar. 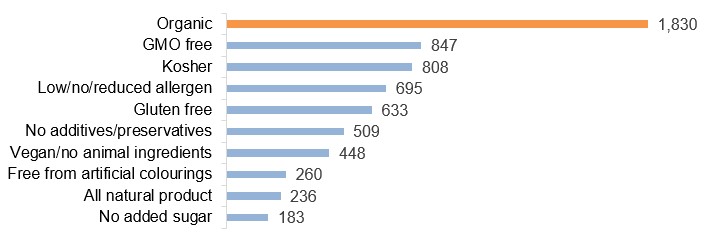
Description of above image
Source: Mintel, 2022 Total item count: 1,830 Product examples – organicOrganic Creamy Peanut Butter Spread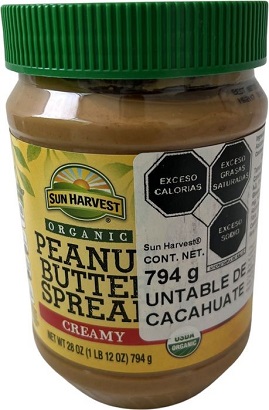 Source: Mintel, 2022
This product is new to the range. This USDA certified organic spread, according to the Secretariat of Health for Mexico, is high in calories, saturated fats and sodium. It is described as velvety smooth, can be spread on sandwiches or simply enjoyed as is with a spoon and does not require stirring. It retails in a 794 gram pack. According to the manufacturer, Sun Harvest embodies a green lifestyle with a wide collection of products that are natural, organic and earth friendly. Organic Pure Maple Syrup Source: Mintel, 2022
This grade A product is said to be rich in taste and amber in color. It is kosher-certified, fat-free and retails in a 250 millilitre pack. Organic Early Grey Chocolate Raspberry Black Tea Source: Mintel, 2022
This product has been repackaged with an updated design. This organic and kosher certified black tea has been naturally flavoured and is gluten-free. It has been naturally flavored and retails in a recyclable 37.5 gram pack containing 15 2.5 gram teabags, which are compostable, and printed with vegetable ink. The pack also features featuring brewing instructions and the Enterprise Familiale Canadienne, Fairtrade logos. Health and wellness distribution channelsIn Mexico, non-grocery specialist stores with sales of US$532.8 million (2021/2020: +4.0%) that are the source of important NH and organic brands, along with shopping centres that began to open up in the second half of 2021, helped bolster HW sales of healthy beverages at retail and on-trade locations in urban areas frequented by many office workers. These distribution channels, which were disproportionally affected by a decline during shutdowns in the previous year, in some cases were made up in the increases of online sales (+5.3%) at US$198.4 million in 2021 - but only high-income consumers moved to these higher priced items.Footnote 2 A wide range of products that target the health and wellness concerns of consumers are offered through different distribution channels. Modern grocery retailers with the majority 72.4% market share at US$13.1 billion and traditional grocery retailers (23.4%) at US$4.2 billion in 2021, remain the most popular outlets, particularly for fortified foods and beverage sales, along with products low in calories or fat. Over the review period (2021/2020), traditional food/drink/tobacco specialist retailers increased the most in sales by 13.9% (US$201.0 million), while modern grocery retailers (+4.7%) have contributed to growth in sales of HW products with its outlets offering a wider variety of HW brands and products.Footnote 2 Although COVID-19 has served to bolster consumers' health-consciousness, as sales through convenience stores at US$909.0 million (+5.2%) and forecourt retailers at US$88.0 million (+7.7%) returned in 2021, impulse purchases for on-the-go consumption of processed foods and drinks, driven by typical indulgence-seeking behaviours were favored more often in these outlets. Meanwhile in 2021, organic and naturally healthy products were mostly available through specialist retailers, supermarkets at sales of US$5.4 billion (+4.9%) and hypermarkets at US$4.3 billion (+4.3%) over the same review period.Footnote 2
Health and wellness opportunities for CanadaBoth the COVID-19 crisis and the introduction of the new labelling regulation (NOM051) that came into force in October 2020, has served to reinforce health concerns that were already gaining in urgency before the pandemic. There is a rising awareness of the seriousness of the problem of obesity in Mexico and Mexicans are increasingly adopting a more holistic and preventative approach to focus on the role that nutritional health plays in maintaining both physical and mental wellbeing.Footnote 2 With a strong platform, further development of more sophisticated products by companies and the increased availability of new HW packaged food and beverage brands, particularly low sugar and naturally non-sweet products will continue to gain in relevance in Mexico over the forecast period (2021 to 2026). Nevertheless, as consumers' confidence and purchasing power adjusts towards added stress imposed by the pandemic, under this significant financial constraint many Mexicans may shift to regular, more affordable products or brands. Those premium products that were only beginning to gain in demand as consumer base incomes rose, such as cold brews and functional waters, may struggle over the coming few years. And, although political decisions to ban all products with black seals (high in sugar, fat or salt) from sale at public schools for example have raised awareness, the new regulation has not significantly shifted consumption of already widely perceived unhealthy products (that is, carbonates). Another impeding constraint on growth for International HW brands and products into Mexico includes the trend towards local production, where consumers are increasingly looking for products of Mexican origin.Footnote 2 For more informationThe Canadian Trade Commissioner Service: International Trade Commissioners can provide Canadian industry with on-the-ground expertise regarding market potential, current conditions and local business contacts, and are an excellent point of contact for export advice. More agri-food market intelligence:
International agri-food market intelligence
Agri-food market intelligence service More on Canada's agriculture and agri-food sectors:
Canada's agriculture sectors For additional information on the upcoming flagship tradeshows in Mexico, please contact:
Ben Berry, Deputy Director Resources
Sector Trend Analysis – Health and wellness – Packaged food and beverage trends in Mexico Prepared by: Erin-Ann Chauvin, Senior Market Analyst © His Majesty the King in Right of Canada, represented by the Minister of Agriculture and Agri-Food (2023).
Photo credits To join our distribution list or to suggest additional report topics or markets, please contact: Agriculture and Agri-Food Canada, Global Analysis1341 Baseline Rd, Tower 5, 3rd floor Ottawa ON K1A 0C5 Canada Email: Esta dirección de correo electrónico está siendo protegida contra los robots de spam. Necesita tener JavaScript habilitado para poder verlo. The Government of Canada has prepared this report based on primary and secondary sources of information. Although every effort has been made to ensure that the information is accurate, Agriculture and Agri-Food Canada (AAFC) assumes no liability for any actions taken based on the information contained herein. Reproduction or redistribution of this document, in whole or in part, must include acknowledgement of agriculture and agri-food Canada as the owner of the copyright in the document, through a reference citing AAFC, the title of the document and the year. Where the reproduction or redistribution includes data from this document, it must also include an acknowledgement of the specific data source(s), as noted in this document. Agriculture and Agri-Food Canada provides this document and other report services to agriculture and food industry clients free of charge. |
México | Envases y etiquetado | Mercados | Legislación y normativa | Intersectorial | Miércoles, 08 Marzo 2023 | ||||||||||||||||||||||||||||||||||||||||||||||||||||||||||||||||||||||||||||||||||||||||||||||||||||||||||||||||||||||||||||||||||||||||||||||||||||||||||||||||||||||||||||||||||||||||||||||||||||||||||||||||||||||||||||||||||||||||||||||||||||||||||||||||||||||||||||||||||||||||||||||||||||||||||||||||||||||||||||||||||||||||||||||||||||||||||||||||||||||||||||||||||||||||||||||||||||||||||||||||||||||||||||||||||||||||||||||||||||||||||||||||||||||||||||||||||||||||||||||||||||||||||||||||||||||||||||||||||||||||||||||||||||||||||||||||||||||||||||||||||||||||||||||||||||||||||||||||||||||||||||||||||||||||||||||||||||||||||||||||||||||||||||||||||||||||||||||||||||||||||||||||||||||||||||||||||||||||||||||||||||||||||||||||||||||||||||||||||||||||||||||||||||||||||||||||||||||||||||||||||||||||||||||||||||||||||||||||||||||||||||||||||||||||||||||||||||||||||||||||||||||||||||||||||||||||||||||||||||||||||||||||||||||||||||||||||||||||||||||||||||||||||||||||||||||||||||||||||||
| New online platform launched to help food manufacturers with efficiency and productivity |  The Food and Drink Innovation Gateway is a one-stop online tool which connects businesses in the sector, particularly small and medium sized, with a wide range of independent advice and expertise, from commercial authorities through to universities and government-backed programmes. FDF said this partnership would support companies to develop and grow their businesses through the adoption of existing and new technologies, including automation, AI and digital, as well as improving their energy efficiency, reduce waste and help to tackle labour shortages. InvestThe FDF’s chief executive Karen Betts said that the UK’s food and drink businesses are the lifeblood of homes and communities. “The FDF’s Innovation Gateway is designed to provide a much-needed ‘single point of entry’ for companies in our sector which are looking to invest in innovation, automation, new technologies and environmental sustainability. It will help to match businesses with the right support, which already exists in a range of different organisations across the UK but which can be difficult to identify and access,” said Betts. “I’m proud of the very practical support that FDF’s Gateway will offer to our dynamic sector, helping food and drink businesses to grow and thrive, and to remain at the heart of advanced manufacturing and a green economy.” CornerstoneThe new platform was launched at DEFRA’S National Food and Drink Summit this week. “The food and drink industry is a cornerstone of our economy and the largest manufacturing sector in the UK. SMEs are at the heart of this, making up 98% of food and drink manufacturers and employing 146,000 people across the country,” said Food and Farming Minister Mark Spencer MP. “They are global leaders in innovation and I am delighted the FDF’s new Food and Drink Innovation Gateway will be open to them, making it easier for them to adopt new technology.” |
Reino Unido | Logística | Producción | Intersectorial | Miércoles, 08 Marzo 2023 | ||||||||||||||||||||||||||||||||||||||||||||||||||||||||||||||||||||||||||||||||||||||||||||||||||||||||||||||||||||||||||||||||||||||||||||||||||||||||||||||||||||||||||||||||||||||||||||||||||||||||||||||||||||||||||||||||||||||||||||||||||||||||||||||||||||||||||||||||||||||||||||||||||||||||||||||||||||||||||||||||||||||||||||||||||||||||||||||||||||||||||||||||||||||||||||||||||||||||||||||||||||||||||||||||||||||||||||||||||||||||||||||||||||||||||||||||||||||||||||||||||||||||||||||||||||||||||||||||||||||||||||||||||||||||||||||||||||||||||||||||||||||||||||||||||||||||||||||||||||||||||||||||||||||||||||||||||||||||||||||||||||||||||||||||||||||||||||||||||||||||||||||||||||||||||||||||||||||||||||||||||||||||||||||||||||||||||||||||||||||||||||||||||||||||||||||||||||||||||||||||||||||||||||||||||||||||||||||||||||||||||||||||||||||||||||||||||||||||||||||||||||||||||||||||||||||||||||||||||||||||||||||||||||||||||||||||||||||||||||||||||||||||||||||||||||||||||||||||||||
| Organic 2.0 |  CHICAGO — The US Department of Agriculture National Organic Program (NOP) issued the Strengthening Organic Enforcement (SOE) Act in January after publishing the proposed rule two years earlier. The new rules governing the $57.5 billion organic food industry will close gaps in current organic regulations and build consistent certification practices to prevent fraud and improve the transparency and traceability of organic products. The rules go into effect March 20. Implementation must be completed within one year. “This regulation will have significant and far-reaching impacts on the organic sector and will do much to deter and detect organic fraud and protect organic integrity throughout the supply chain,” said Tom Chapman, executive director and chief executive officer, Organic Trade Association, Washington. “Fraud in the organic system — wherever it occurs — harms the entire organic sector and shakes the trust of consumers in organic.” The rules were necessary because consumers started questioning the truthfulness in organic claims due to a growing number of people making headlines by selling non-organic products as USDA certified. For example, at about the same time the SOE was published, a Minnesota farmer was indicted on charges stemming from a $46 million fraud scheme. The charges allege the farmer cultivated conventional crops using chemical fertilizers and pesticides and falsely provided purchasers with copies of NOP certification. The SOE aims to prevent such fraud in the future. It also closes loopholes that allowed ingredients that don’t meet NOP standards to infiltrate the supply chain. Key updates include requiring certification of more of the businesses, including brokers and traders, at critical links in organic supply chain. The SOE also requires organic certificates for all organic imports and creates authority for more robust recordkeeping, traceability practices and fraud prevention procedures. “The time is now to assess your supply chain and identify uncertified suppliers,” said Liz Figueredo, technical lead, Quality Assurance International, San Diego. “An estimated 1,000 businesses that were exempt under the old regulations now need to be certified, and companies currently certified now need to develop and implement fraud protection plans.” It’s important to focus on traceability, from raw materials to finished products, said Steven Moore, vice president of food safety, quality, regulatory and innovation, Scoular, Omaha, Neb. He suggested reviewing the NOP handbook and performing an unbiased internal audit of your entire organic management system. Arnold Coombs, executive director of sales and marketing, Bascom Maple Farms, Alstead, NH, said, “I don’t think that producers who are already USDA certified will have much of a challenge. And I think those of us who are USDA certified are proud of what that means for our product, and we will continue to comply in every way possible to ensure our customers get the products they can trust and deserve.” Yet, there is work involved for everyone who is part of the organic supply chain. While legitimate businesses are pleased with the efforts to prevent fraud, there is some fear it will burden the supply chain. “The process across the whole supply chain may become too complex,” said Tania Moreira, senior account manager – west region, AAK USA, Louisville, Ky. “Farmers or processors may not have the infrastructure or resources to be able to comply with all that is required. This could decrease organic supply and increase prices.” Michael Ivey, national sales director, Butter Buds Inc., Racine, Wis., said, “We’ve already started to put many of these practices in place, but it has taken substantial time and resource commitment.” Coming into complianceFarming is not easy. Organic farming is even more difficult. “If you are doing all the right things, you should get paid for it,” said Beth Robertson-Martin, partnership development, Merge Impact, Morrison, Ill. “This is for farmers and brands alike.” Annie Bouchard, senior brand manager, Fruit d’Or, Villeroy, Que., said, “It takes an incredible amount of work and dedication to grow organic crops at a scale that satisfies market demands. Organic isn’t something that is quick to initiate or get into compliance with if brands are not already. “Our best recommendation is to work with the companies that have been doing organic from the beginning. We never ‘went organic.’ We started out that way.” Not every company starts organic or works with only organic, but many have known the rules were coming since the proposal was issued in 2021. They have been working toward and are ready for implementation. Kerry, Beloit, Wis., has new organic-certified taste modulating solutions that meet the new rule. “We have our taste solutions ready and fully certified, but there is still a lot of work ahead for product developers in making sure their organic products not only meet the new standards but also continue to taste great,” said Otis Curtis, global portfolio director – Tastesense with Kerry. “These updated requirements for organic labeling involve a large number of new actions that US organic product developers must understand and meet. These include calculating the percentage of organically produced ingredients, and filing and having available certified reports for all of these.” Alina Slotnik, vice president – bioactives, Brightseed, San Francisco, said, “Launching an organic ingredient is no easy feat. We know this firsthand. This new ruling helps affirm that the work we’ve put in to attain this important label designation is worth the effort.” Brightseed is introducing an organic hemp ingredient for gut health. It is sourced from upcycled hemp hulls and formulated to optimize bioactive content. “There is an incredible amount of upfront planning required when launching an organic ingredient or product,” Ms. Slotnik said. “The earlier brands can anticipate their future demand for organic ingredients, the better. This gives suppliers ample time to ensure their raw material growers and processing facilities are in alignment with organic regulations.” Implementing the new rules is more taxing for imported ingredients. All businesses importing organic agricultural products to the United States must obtain a NOP Import Certificate from a certifying agent accredited by the USDA or from a foreign certifying agent authorized under an organic trade arrangement prior to their shipment. “One of the biggest challenges may be centered around assuring applicable documentation, including the newly required import certificates from our US brokers and distributors, as well as maintaining all of the required manufacturer’s documentation and export certificates,” said Tim Sonntag, vice president of quality assurance and regulatory for Wixon, St. Francis, Wis. “It’s not just documentation; it’s proper labeling, too. The information can no longer just be on a spreadsheet. “Organic product developers also need to ensure the non-retail containers used to ship or store certified organic products are labeled with organic identity, production lot number, shipping information and unique information linking the container directly to the audit trail documentation. Audit trail documentation must identify the last certified operation that handled the organic product.” The new regulations also directly impact product developers by requiring the calculation of the percentage of organically produced ingredients in a product in order to be compliant with using the USDA organic seal. The label is allowed on packaged products made with 100% organically produced ingredients, and it also may be placed on packaged products containing at least 95% organic ingredients. The calculation of 95% organic ingredients in the old rules was stated as “dividing the total net weight (excluding water and salt) of combined organic ingredients at formulation by the total weight (excluding water and salt) of the finished product.” “This never made sense so we used the SOE to provide clarification,” said Gwendolyn Wyard, vice president of regulatory and technical affairs at the OTA. “Most companies were doing it the right way, but now it’s official.” The new rule reads “dividing the total net weight of the combined organic ingredients at formulation by the total weight of all ingredients of the product at formulation. Water and salt added as ingredients at formulation are excluded from the calculation.” The 5% of allowed non-organically produced agricultural ingredients and processing aids may be found in Title 7 Part 205 of the Code of Federal Regulations, along with all of the requirements of NOP. What’s key about the 5% is it must be on the list and it is not commercially available in organic form. Commercial availability is defined as available in the form, quality and/or quantity needed. Cost is not an acceptable reason to use non-organic. Further, a packaged product with the organic seal cannot contain organic and non-organic forms of the same ingredient. Ms. Wyard said the list of ingredients is up for review and there may be some ingredients removed by the end of this year. Those up for discussion include flavors, a number of gums and de-oiled lecithin. |
EEUU | Legislación y normativa | Clientes | Producción | Intersectorial | Martes, 07 Marzo 2023 | ||||||||||||||||||||||||||||||||||||||||||||||||||||||||||||||||||||||||||||||||||||||||||||||||||||||||||||||||||||||||||||||||||||||||||||||||||||||||||||||||||||||||||||||||||||||||||||||||||||||||||||||||||||||||||||||||||||||||||||||||||||||||||||||||||||||||||||||||||||||||||||||||||||||||||||||||||||||||||||||||||||||||||||||||||||||||||||||||||||||||||||||||||||||||||||||||||||||||||||||||||||||||||||||||||||||||||||||||||||||||||||||||||||||||||||||||||||||||||||||||||||||||||||||||||||||||||||||||||||||||||||||||||||||||||||||||||||||||||||||||||||||||||||||||||||||||||||||||||||||||||||||||||||||||||||||||||||||||||||||||||||||||||||||||||||||||||||||||||||||||||||||||||||||||||||||||||||||||||||||||||||||||||||||||||||||||||||||||||||||||||||||||||||||||||||||||||||||||||||||||||||||||||||||||||||||||||||||||||||||||||||||||||||||||||||||||||||||||||||||||||||||||||||||||||||||||||||||||||||||||||||||||||||||||||||||||||||||||||||||||||||||||||||||||||||||||||||||||||||
| Crise de la bio : quel est létat desprit des industriels de la bio ? |  Dans le cadre de la demande d’un plan de sauvegarde auprès des pouvoirs publics, le Synabio, syndicat des transformateurs de la bio, a réalisé un sondage auprès de ses adhérents entre fin novembre et début janvier. Ils ont été 56 dirigeants à répondre. Qu’en ressort-il ?
86% des adhérents ont indiqué que cette situation chaotique intervient alors qu’ils ont engagé des investissements importants pour le développement de leurs entreprises au cours des trois dernières années. De leurs côtés, Forébio et la Coopération agricole ont réalisé le même type d’enquête auprès des opérateurs. En voici les quatre enseignements :
|
Francia | Mercados | Intersectorial | Martes, 07 Marzo 2023 | ||||||||||||||||||||||||||||||||||||||||||||||||||||||||||||||||||||||||||||||||||||||||||||||||||||||||||||||||||||||||||||||||||||||||||||||||||||||||||||||||||||||||||||||||||||||||||||||||||||||||||||||||||||||||||||||||||||||||||||||||||||||||||||||||||||||||||||||||||||||||||||||||||||||||||||||||||||||||||||||||||||||||||||||||||||||||||||||||||||||||||||||||||||||||||||||||||||||||||||||||||||||||||||||||||||||||||||||||||||||||||||||||||||||||||||||||||||||||||||||||||||||||||||||||||||||||||||||||||||||||||||||||||||||||||||||||||||||||||||||||||||||||||||||||||||||||||||||||||||||||||||||||||||||||||||||||||||||||||||||||||||||||||||||||||||||||||||||||||||||||||||||||||||||||||||||||||||||||||||||||||||||||||||||||||||||||||||||||||||||||||||||||||||||||||||||||||||||||||||||||||||||||||||||||||||||||||||||||||||||||||||||||||||||||||||||||||||||||||||||||||||||||||||||||||||||||||||||||||||||||||||||||||||||||||||||||||||||||||||||||||||||||||||||||||||||||||||||||||||
Página 1 de 66