Indicadores
| Título del ítem | Sumario | Categorías | Creado | ||||||||||||||||||||||||||||||||||||||||||||||||||||||||||||||||||||||||||||||||||||||||||||||||||||||||||||||||||||||||||||||||||||||||||||||||||||||||||||||||||||||||||||||||||||||||||||||||||||||||||||||||||||||||||||||||||||||||||||||||||||||||||||||||||||||||||||||||||||||||||||||||||||||||||||||||||||||||||||||||||||||||||||||||||||||||||||||||||||||||||||||||||||||||||||||||||||||||||||||||||||||||||||||||||||||||||||||||||||||||||||||||||||||||||||||||||||||||||||||||||||||||||||||||||||||||||||||||||||||||||||||||||||||||||||||||||||||||||||||||||||||||||||||||||||||||||||||||||||||||||||||||||||||||||||||||||||||||||||||||||||||||||||||||||||||||||||||||||||||||||||||||||||||||||||||||||||||||||||||||||||||||||||||||||||||||||||||||||||||||||||||||||||||||||||||||||||||||||||||||||||||||||||||||||||||||||||||||||||||||||||||||||||||||||||||||||||||||||||||||||||||||||||||||||||||||||||||||||||||||||||||||||||||||||||||||||||||||||||||||||||||||||||||||||||||||||||||||||||
|---|---|---|---|---|---|---|---|---|---|---|---|---|---|---|---|---|---|---|---|---|---|---|---|---|---|---|---|---|---|---|---|---|---|---|---|---|---|---|---|---|---|---|---|---|---|---|---|---|---|---|---|---|---|---|---|---|---|---|---|---|---|---|---|---|---|---|---|---|---|---|---|---|---|---|---|---|---|---|---|---|---|---|---|---|---|---|---|---|---|---|---|---|---|---|---|---|---|---|---|---|---|---|---|---|---|---|---|---|---|---|---|---|---|---|---|---|---|---|---|---|---|---|---|---|---|---|---|---|---|---|---|---|---|---|---|---|---|---|---|---|---|---|---|---|---|---|---|---|---|---|---|---|---|---|---|---|---|---|---|---|---|---|---|---|---|---|---|---|---|---|---|---|---|---|---|---|---|---|---|---|---|---|---|---|---|---|---|---|---|---|---|---|---|---|---|---|---|---|---|---|---|---|---|---|---|---|---|---|---|---|---|---|---|---|---|---|---|---|---|---|---|---|---|---|---|---|---|---|---|---|---|---|---|---|---|---|---|---|---|---|---|---|---|---|---|---|---|---|---|---|---|---|---|---|---|---|---|---|---|---|---|---|---|---|---|---|---|---|---|---|---|---|---|---|---|---|---|---|---|---|---|---|---|---|---|---|---|---|---|---|---|---|---|---|---|---|---|---|---|---|---|---|---|---|---|---|---|---|---|---|---|---|---|---|---|---|---|---|---|---|---|---|---|---|---|---|---|---|---|---|---|---|---|---|---|---|---|---|---|---|---|---|---|---|---|---|---|---|---|---|---|---|---|---|---|---|---|---|---|---|---|---|---|---|---|---|---|---|---|---|---|---|---|---|---|---|---|---|---|---|---|---|---|---|---|---|---|---|---|---|---|---|---|---|---|---|---|---|---|---|---|---|---|---|---|---|---|---|---|---|---|---|---|---|---|---|---|---|---|---|---|---|---|---|---|---|---|---|---|---|---|---|---|---|---|---|---|---|---|---|---|---|---|---|---|---|---|---|---|---|---|---|---|---|---|---|---|---|---|---|---|---|---|---|---|---|---|---|---|---|---|---|---|---|---|---|---|---|---|---|---|---|---|---|---|---|---|---|---|---|---|---|---|---|---|---|---|---|---|---|---|---|---|---|---|---|---|---|---|---|---|---|---|---|---|---|---|---|---|---|---|---|---|---|---|---|---|---|---|---|---|---|---|---|---|---|---|---|---|---|---|---|---|---|---|---|---|---|---|---|---|---|---|---|---|---|---|---|---|---|---|---|---|---|---|---|---|---|---|---|---|---|---|---|---|---|---|---|---|---|---|---|---|---|---|---|---|---|---|---|---|---|---|---|---|---|---|---|---|---|---|---|---|---|---|---|---|---|---|---|---|---|---|---|---|---|---|---|---|---|---|---|---|---|---|---|---|---|---|---|---|---|---|---|---|---|---|---|---|---|---|---|---|---|---|---|---|---|---|---|---|---|---|---|---|---|---|---|---|---|---|---|---|---|---|---|---|---|---|---|---|---|---|---|---|---|---|---|---|---|---|---|---|---|---|---|---|---|---|---|---|---|---|---|---|---|---|---|---|---|---|---|---|---|---|---|---|---|---|---|---|---|---|---|---|---|---|---|---|---|---|---|---|---|---|---|---|---|---|---|---|---|---|---|---|---|---|---|---|---|---|---|---|---|---|---|---|---|---|---|---|---|---|---|---|---|---|---|---|---|---|---|---|---|---|---|---|---|---|---|---|---|---|---|---|---|---|---|---|---|---|---|---|---|---|---|---|---|---|---|---|---|---|---|---|---|---|---|---|---|---|---|---|---|---|---|---|---|---|---|---|---|---|---|---|---|---|---|---|---|---|---|---|---|---|---|---|---|---|---|---|---|---|---|---|---|---|---|---|---|---|---|---|---|---|---|---|---|---|---|---|---|---|---|---|---|---|---|---|---|---|---|---|---|---|---|---|---|---|---|---|---|---|---|---|---|---|---|---|---|---|---|---|---|---|---|---|---|---|---|---|---|---|---|---|---|---|---|---|---|---|---|---|---|---|---|---|---|---|---|---|---|---|---|---|---|---|---|---|---|---|---|---|---|---|---|---|---|---|---|---|---|---|---|---|---|---|---|---|---|---|---|---|---|---|---|---|---|---|---|---|---|---|---|---|---|---|---|---|---|---|---|---|---|---|---|---|---|---|---|---|---|---|---|---|---|---|---|---|---|---|---|---|---|---|---|---|---|---|---|---|---|---|---|---|---|---|---|---|
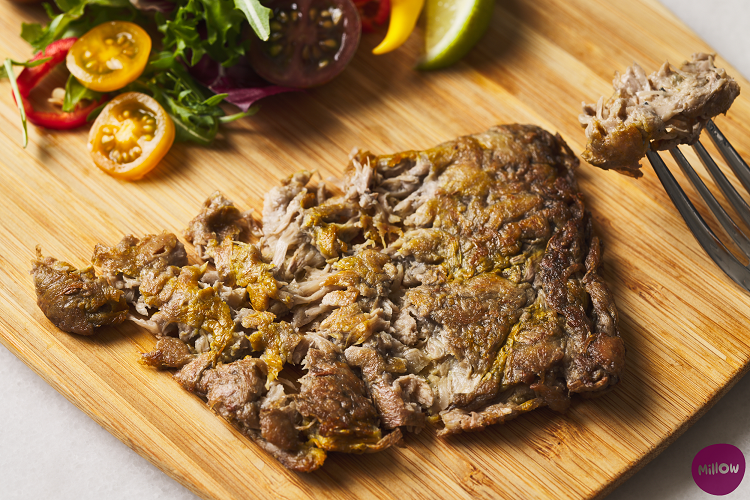
| Fungi and oat hybrid makes ‘completely new protein for alternative meat sector | For more than 20 years, Prof Mohammad Taherzadeh has been working to better understand mycelium, the root-like structure from which fungi grow, at the University of Borås in Sweden. His conviction? That mycelium can offer a sustainable, scalable, and economically feasible alternative to meat. Having established a start-up, Millow, Prof Taherzadeh is working to put his ‘completely new’ mycelium-based protein on people’s plates. Two ingredients: mycelium and oatsMillow, which is both the name of Prof Taherzadeh’s product and his company, is founded on novel production techniques. The start-up grows mycelium on a substrate, which could be any grain or vegetable. Millow, for the most part, is using oats. “We like oats. They’re very nutritious, they have [lots of] vitamins and minerals, and they’re readily accessible all over the world,” Millow chair Staffan Hillberg explained. That makes for a ‘huge’ sustainability advantage, since when locally grown oats are used, transport-related emissions are limited. Millow uses a ‘controlled environment fermentation’ process, whereby part of the oats component is consumed by mycelia, resulting in a structured mycelia/oat hybrid. The process improves the digestibility of what would otherwise be raw oats, and retains their vitamins and minerals, we were told. From a macronutrient perspective, the start-up is able to ‘program’ the protein content by controlling the environment of its production units. “We’re aiming at around 20% protein, which we believe is a good number for human consumption.” In blending mycelium and oats in the fermentation process, a unique texture is ‘built in’ to the product. Essentially, when the mycelium feeds on the oats it adds a kind of scaffolding. The benefit here is that minimal processing is required to shape the protein into meat alternative products. “Since we’re using the mycelium to build the texture, we don’t need any binders or additives afterwards,” Hillberg told this publication.
Being neutral in taste means there is no need to mask off-notes with additional ingredients, as can be the case with some soy and pea proteins. And importantly for food formulators, the protein can withstand variations in temperature – including boiling processes. Setting itself apart in the mycelium spacePrior to developing Millow’s unique fermentation process, Prof Taherzadeh studied different processes for mycoprotein production including traditional liquid fermentation. This is the technique used by meat alternative maker Marlow Foods-owned Quorn. He found the liquid fermentation process water-intensive and energy inefficient. Millow’s ‘controlled environment fermentation’ process uses 2.3% of the water and one-third of the energy used by traditional mycelium technologies, claims the start-up. Millow also prides itself on being modular and scalable. Instead of using large-scale fermenters – Quorn’s fermenters are 40m high – Millow opts for a greater number of smaller units. If one unit should fail, or become contaminated, it won’t affect the other units, Hillberg explained. As to scaling, each unit will be capable of producing around 220kg of product per day. “When we scale, we don’t build bigger units – we just add more.” Again, compared to traditional mycelium technologies, Millow claims it requires one-third of the investment and reduces CO2 emissions. Controlled environmental fermentation allows for temperature, water, and other inputs to be ‘minutely’ controlled. “That is why it is so energy efficient,” we were told. From start to finish, production time comes in at under 24 hours. “That is also very unique,” Hillberg stressed. “Essentially, you could install this process in the middle of Africa and produce food very efficiently and very nutritiously for people who don’t have access to this type of food.” 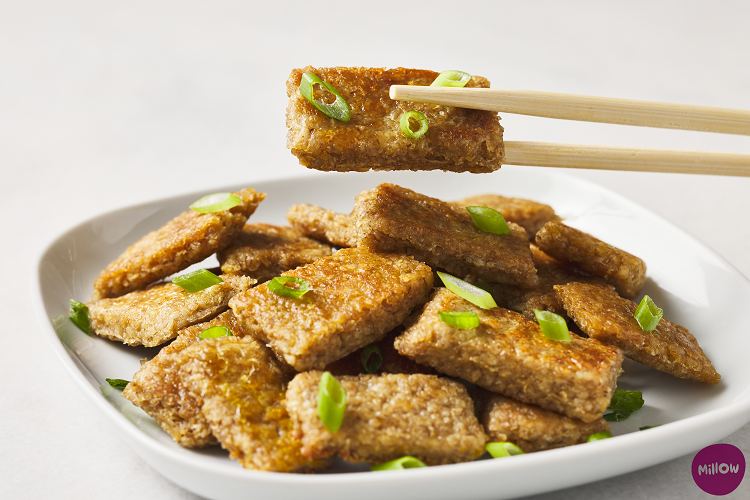
At least one other company is fermenting mycelium on legumes and grains for food production. Israel-based Kinoko-Tech grows mycelium in a mixture of legumes and grains via a solid-state fermentation process. Similarly to Millow, Kinoko-Tech told us the fermentation process enables a ‘desirable mouthfeel and texture without the need for additional processing’. Kinoko-Tech is doing ‘something similar’, but it’s not strictly the same, explained Millow’s Hillberg, adding that their production processes differ. “We have a complete production process which is automated.” From unit to marketMillow is targeting the B2B meat alternative market. The first products are founded on a mycelium strain already authorised for use in food applications. For this reason, Millow will not initially be required to pass through Novel Foods regulations. But regulatory approval is required for blending mycelia with oats. This has already been granted by the Swedish Food Agency and Millow doesn’t foresee any issues in entering other markets. Although starting with a known mycelia strain, Millow has access to more than 1,000 different mycelium strains, the majority of which would require pre-market approval as a novel food. The company is already experimenting with some of these, observing that different strains bring different properties to its production product. “They can impact colour, texture and taste,” Hillberg explained. 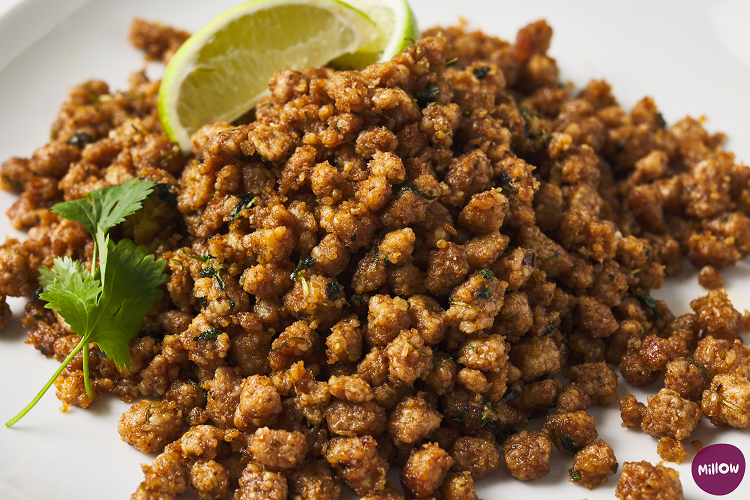
With regulatory approval assured in Sweden, Millow’s next plan is to scale up. The company has established a pilot plant on home soil and is in the early stages of partnering with food manufacturers in the Nordics. Current products in the pipeline include a mince alternative and meat-free ‘bites’. “We’ll start scaling up production [with plans to] launch in 2024.” Although supplying B2B to alt meat makers, being a structured product, Millow sees itself as more than an ingredient. As such, products containing Millow’s protein will carry the Millow branding, Hillberg explained. “We’re much more than an ingredient, we’re almost a finished product from a production point of view.” |
Mundial | Mercados | Producción | Otros | Jueves, 16 Marzo 2023 | ||||||||||||||||||||||||||||||||||||||||||||||||||||||||||||||||||||||||||||||||||||||||||||||||||||||||||||||||||||||||||||||||||||||||||||||||||||||||||||||||||||||||||||||||||||||||||||||||||||||||||||||||||||||||||||||||||||||||||||||||||||||||||||||||||||||||||||||||||||||||||||||||||||||||||||||||||||||||||||||||||||||||||||||||||||||||||||||||||||||||||||||||||||||||||||||||||||||||||||||||||||||||||||||||||||||||||||||||||||||||||||||||||||||||||||||||||||||||||||||||||||||||||||||||||||||||||||||||||||||||||||||||||||||||||||||||||||||||||||||||||||||||||||||||||||||||||||||||||||||||||||||||||||||||||||||||||||||||||||||||||||||||||||||||||||||||||||||||||||||||||||||||||||||||||||||||||||||||||||||||||||||||||||||||||||||||||||||||||||||||||||||||||||||||||||||||||||||||||||||||||||||||||||||||||||||||||||||||||||||||||||||||||||||||||||||||||||||||||||||||||||||||||||||||||||||||||||||||||||||||||||||||||||||||||||||||||||||||||||||||||||||||||||||||||||||||||||||||||||
| Sector Trend Analysis – Plant-based food trends in Mexico | Note: This report includes forecasting data that is based on baseline historical data. Executive summaryRetail sales of plant-based food are still negligible in Mexico. However, the market this is expected to change over the forecast period as more products become available (Euromonitor International,2022). Growing health concerns on obesity and diabetes might also encourage Mexican consumers to shift from meat to plant-based food. In 2022, market size for plant-based protein ingredients (non-animal derived proteins) in Mexico was weighed at 96.6 thousand tonnes. From 2017 to 2022, sales of plant-based protein ingredients recorded a compound annual growth rate (CAGR) of 5.4%. During the 2022-2027 period, sales of plant-based protein ingredients is forecast to record a CAGR of 3.9%, reaching 117.1 thousand tonnes in 2026. In Mexican food market, plant-based protein ingredients are most used in pet food products. In 2022, 88.5 tonnes of plant-based protein ingredients were used in pet food (80.2 tonnes used in dog food). During the 2022-2027 period, demand of plant-based protein ingredients in pet food is forecast to record a CAGR of 0.2%, reaching 89.6 tonnes in 2026. In 2021, Mexico was the 22nd largest importer of plant-based protein ingredients in the world. The country recorded total imports valued at US$792.8 million in 2021, which increased at a CAGR of 2.1% from 2017. In 2021, Canada was Mexico's 13th largest plant-based protein ingredients in 2021, representing 0.5% market share or US$ 3.9 million. Among plant-based protein ingredients that Mexico imported from Canada, wheat gluten saw the highest growth at a CAGR of 710.3% from 2017 to 2021. According to data from Mintel, 138 plant-based food products were launched in Mexico between 2017 and 2021. Snacks, bakery, and Processed fish, meat & egg products were top categories of newly released plant-based food launches while social media, kosher, and no additives/preservatives were top claims associated with plant-based food released during the prescribed period. PepsiCo, Kellogg, and Haribo were the three companies with the most launches in the past five years. Market overviewAs patent activity in plant-based food and drink continues to grow around the world, innovators are actively developing more sophisticated meat substitutes, be it through ever more complex meat-like products, or increasing realism in appearance, texture, or cooking experience (Mintel, 2021). Despite recent reports about declining sales driven primarily by some companies' unrealistic forecasts, plant-based trend continues to grow in retail sales and in foodservice (Euromonitor International,2022). Motivated by consumers' increasing health, sustainability/environmental and animal welfare concerns, plant-based eating, consumption of alternative proteins, and the move away from animal-derived food products are continuing to grow in the markets like Mexico. According to Euromonitor International, while the number of vegan or vegetarian consumers is small worldwide, the number who are trying to limit their animal product consumption is much more significant for meat that has now reached 22.5% globally. The demand for plant-based food products is increasing in Mexico (USDA, 2022). The ongoing Covid-19 pandemic has encouraged Mexican consumers to focus their diet on healthier options. Surveys conducted by Euromonitor International found that 67% of respondents (versus a global average of 56%) reported looking for health ingredients in food and drink, 30% of respondents said they were trying to reduce their meat consumption, and 90% of the respondents indicated they would like to intake plant-based proteins more often (Euromonitor International, Ministerie van Landbouw, Natuur en Voedselkwaliteit, 2022). Retail sales of plant-based food are still negligible in Mexico. However, the market this is expected to change over the forecast period as more products become available (Euromonitor International,2022). Growing health concerns on obesity and diabetes might also encourage Mexican consumers to shift from meat towards plant-based food. Market sizeIn 2022, market size of plant-based protein ingredients (non-animal derived proteins) in Mexico was valued at 96.6 thousand tonnes. From 2017 to 2022, sales of plant-based protein ingredients recorded a CAGR of 5.4%. During the 2022-2027 period, sales of plant-based protein ingredients is forecast to record a CAGR of 3.9%, reaching 117.1 thousand tonnes in 2026.
In Mexican food market, plant-based protein ingredients are most used in pet food products. In 2022, 88.5 tonnes of plant-based protein ingredients were used in pet food (80.2 tonnes used in dog food). During the 2022-2027 period, demand of plant-based protein ingredients in pet food is forecast to record a CAGR of 0.2%, reaching 89.6 tonnes in 2026.
Trade overviewIn 2021, Mexico was the 22nd largest importer of plant-based protein ingredients in the world. The country recorded total imports valued at US$792.8 million in 2021, which increased at a CAGR of 2.1% from 2017. In 2021, Canada was Mexico's 13th largest plant-based protein ingredients in 2021, representing 0.5% market share or US$ 3.9 million. Among plant-based protein ingredients that Mexico imported from Canada, wheat gluten saw the highest growth at a CAGR of 710.3% from 2017 to 2021.
New product launchesAccording to data from Mintel, 138 plant-based food products were launched in Mexico between 2017 and 2021. Snacks, bakery, and Processed fish, meat & egg products were top categories of newly released plant-based food launches while social media, kosher, and no additives/preservatives were top claims associated with plant-based food released during the prescribed period. PepsiCo, Kellogg, and Haribo were the three companies with the most launches in the past five years.
Examples of new productsVanilla Lucuma Flavored Organic Plant Protein + Superfoods Source: Mintel, 2022
Sprout Living Epic Protein Proteína Vegetal en Polvo Sabor Vainilla Lúcuma (Vanilla Lucuma Flavored Organic Plant Protein + Superfoods) has been relaunched, previously under Sprout Living Epic, and retails in a 455 gram pack.
Gluten Free Meatless Pepperoni Style Pizza Source: Mintel, 2022
Daiya Pizza Sin Gluten de Peperoni Vegetariano (Gluten Free Meatless Pepperoni Style Pizza) has been reformulated with and a new and improved recipe featuring premium cutting board cheeze shreds. This plant based product is made with gourmet ingredients, and is free from GMOs, dairy, gluten and soy. This vegan pizza is a good source of fiber, and contains saturated fat and sodium excess according to the Mexican Health Secretary. It retails in a recyclable 16.7 ounce pack featuring baking instructions. 24 Carrot Orange Veggie Burgers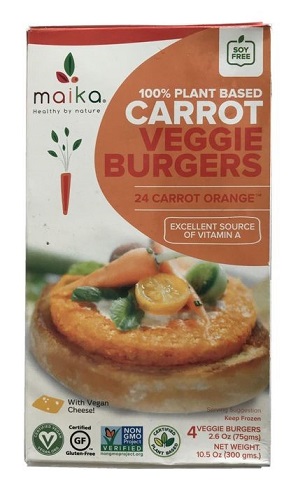 Source: Mintel, 2022
Maika Hamburguesa Vegana de Zanahoria (24 Carrot Orange Veggie Burgers) have been repackaged with an updated design. The 100% plant based product is made with real veggies and vegan cheese, is an excellent source of vitamin A, and is free from soy and GMO. It is certified vegan and retails in a 300 gram pack containing four 75 gram units and featuring cooking instructions, as well as Facebook, Instagram, Pinterest and Twitter logos. The manufacturer claims to be a young plant based food company dedicated to producing premium sustainable products made with a social and environmental. Plant Based No Chicken Seitan Tenders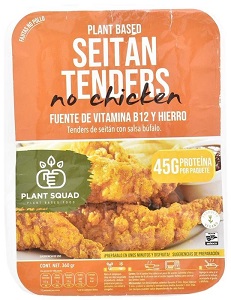 Source: Mintel, 2022
Plant Squad Tenders de Seitán con Salsa Búfalo (Plant Based No Chicken Seitan Tenders) is now available. The vegan product is described as fajitas with buffalo sauce, is a source of vitamin B12 and iron, and features 45 gram protein per pack. It is said to be ready in minutes, can be heated in the microwave, and retails in a 360 gram pack featuring cooking instructions. Plant Based Seitan Barbecue Ribs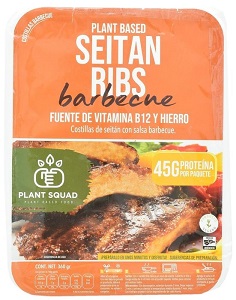 Source: Mintel, 2022
Plant Squad Costillas Vegetarianas de Seitán con Salsa Barbecue (Plant Based Seitan Barbecue Ribs) are now available. The vegan product is a source of vitamin B12 and iron and features 45 gram protein per pack. It is said to be ready in minutes, can be heated in the microwave, and retails in a 360 gram pack featuring cooking instructions. For more informationThe Canadian Trade Commissioner Service: International Trade Commissioners can provide Canadian industry with on-the-ground expertise regarding market potential, current conditions and local business contacts, and are an excellent point of contact for export advice. More agri-food market intelligence:
International agri-food market intelligence
Agri-food market intelligence service More on Canada's agriculture and agri-food sectors:
Canada's agriculture sectors Resources
Sector Trend Analysis – Plant-based food trends in Mexico Prepared by: Zhiduo Wang, Market Analyst © His Majesty the King in Right of Canada, represented by the Minister of Agriculture and Agri-Food (2023).
Photo credits To join our distribution list or to suggest additional report topics or markets, please contact: Agriculture and Agri-Food Canada, Global Analysis1341 Baseline Rd, Tower 5, 3rd floor Ottawa ON K1A 0C5 Canada Email: Esta dirección de correo electrónico está siendo protegida contra los robots de spam. Necesita tener JavaScript habilitado para poder verlo. The Government of Canada has prepared this report based on primary and secondary sources of information. Although every effort has been made to ensure that the information is accurate, Agriculture and Agri-Food Canada (AAFC) assumes no liability for any actions taken based on the information contained herein. Reproduction or redistribution of this document, in whole or in part, must include acknowledgement of agriculture and agri-food Canada as the owner of the copyright in the document, through a reference citing AAFC, the title of the document and the year. Where the reproduction or redistribution includes data from this document, it must also include an acknowledgement of the specific data source(s), as noted in this document. Agriculture and Agri-Food Canada provides this document and other report services to agriculture and food industry clients free of charge. |
México | Estudios de mercado | Mercados | Otros | Miércoles, 08 Marzo 2023 | ||||||||||||||||||||||||||||||||||||||||||||||||||||||||||||||||||||||||||||||||||||||||||||||||||||||||||||||||||||||||||||||||||||||||||||||||||||||||||||||||||||||||||||||||||||||||||||||||||||||||||||||||||||||||||||||||||||||||||||||||||||||||||||||||||||||||||||||||||||||||||||||||||||||||||||||||||||||||||||||||||||||||||||||||||||||||||||||||||||||||||||||||||||||||||||||||||||||||||||||||||||||||||||||||||||||||||||||||||||||||||||||||||||||||||||||||||||||||||||||||||||||||||||||||||||||||||||||||||||||||||||||||||||||||||||||||||||||||||||||||||||||||||||||||||||||||||||||||||||||||||||||||||||||||||||||||||||||||||||||||||||||||||||||||||||||||||||||||||||||||||||||||||||||||||||||||||||||||||||||||||||||||||||||||||||||||||||||||||||||||||||||||||||||||||||||||||||||||||||||||||||||||||||||||||||||||||||||||||||||||||||||||||||||||||||||||||||||||||||||||||||||||||||||||||||||||||||||||||||||||||||||||||||||||||||||||||||||||||||||||||||||||||||||||||||||||||||||||||||
| Coffee with olive oil? Starbucks enriches flavour and texture with EVOO in Europe | An unexpected combination – arabica coffee and cold pressed extra virgin olive oil – has been added to menu boards at Starbucks stores in Italy. Sold under the Oleato brand, the coffee major says the result is ‘velvety smooth’ and ‘delicately sweet’, bringing a ‘new flavour and texture’ to consumers. The company did not disclose at which stage of the coffee making process the olive oil is added, nor whether the decision to include extra virgin olive oil – a mainstay of the Mediterranean diet – in its beverages was informed by nutritional science. Rather, the company suggests Oleato was born out of a recent visit to Sicily by Starbucks founder and interim CEO Howard Schultz, who observed that locals consumed a spoonful of extra virgin olive oil daily. “We are excited to bring an unexpected alchemy of Starbucks finest arabica coffee and oat dairy alternative infused with exactly 1 tablespoon of extra virgin olive oil, transforming the coffee ritual to offer a velvety smooth, deliciously lush new coffee experience,” a Starbucks spokesperson told this publication. ‘Buttery, round flavours and chocolatey notes’Starbucks is collaborating with Sicilian extra virgin olive oil company Partanna on the Oleato line, although details around this partnership were not disclosed. Amy Dilger, principal beverage developer for Starbucks describes Partanna’s olives as ‘uniquely nutty’ with ‘slightly sweet flavours’: “Think of that rich smoothness of a buttery caramel, it’s a natural complement to our coffee.” Infusing Starbucks coffee with Partanna yields a ‘velvety smooth rich texture’, she explained, “with the buttery, round flavours imparted by the olive oil perfectly pairing with the soft, chocolatey notes of the coffee”. This ‘textural experience’, Dilger added, is imparted in both Oleato’s hot and cold formats. The range includes Oleato Caffè Latte, Golden Foam Cold Brew, Iced Shaken Espresso, Iced Cortado, Golden Foam Espresso Martini, and the Oleato Deconstructed – espresso and olive oil infused with passionfruit cold foam. Spotlight on nutritionAlthough Starbucks has not suggested a link between olive oil and potential health benefits, this area is well researched. Olive oil is most associated with the Mediterranean diet, which itself is recognised for preventing disease and ageing. This last year alone has seen a wealth of new research come to light. Out of the University of Seville, research has focused on the cancer- and Alzheimer-preventing qualities of oleic acid (the principal component of olive oil), as well as its associations with lower cholesterol levels. A recent study conducted by researchers from the University of Barcelona found that consumption of extra olive oil during pregnancy increases the level of antioxidants in breast milk and in offspring, and work from the University of South Australia suggests the Mediterranean diet may also help overcome infertility. Comparing the nutritional profile of Starbucks’ Oleato range with its classic range suggests the Oleato line, as expected, has higher calorie content, as well as total fat and saturated fat. Oleato Caffè Latte with Oat Dairy Alternative in Grande beverage size has 336 calories, 23.4g total fat, and 2.9g saturated fat. Starbucks did not provide the macronutrient profile of a standard Caffè Latte with Oat Dairy Alternative, but according to the company website, in Canada a 473ml size has 190 calories, 8g total fat, and 0.5g saturated fat. FoodNavigator acknowledges these products do not offer a like-for-like comparison, as beverage size and beverage/oat milk composition may differ.
Of the Oleato range nutritional information provided, the Oleato Golden Foam Cold Brew in Grande beverage size has the highest calorie content with 397kcal, 300 of which come from fat. Total fat for this beverage is 34.2g and saturated fat, International expansionAlthough launched in Italy last month, Starbucks plans to roll out the Oleato range around the world. “Over the next year, Starbucks Oleato will be thoughtfully introduced in select cities around the world, including in the UK and Middle East,” we were told. “We’re excited to share more about the regional expressions of Starbucks Oleato for customers soon.”
Nutrients
Food Chemistry
Nutrients |
Mundial | Mercados | Clientes | Otros | Aceite | Miércoles, 08 Marzo 2023 | ||||||||||||||||||||||||||||||||||||||||||||||||||||||||||||||||||||||||||||||||||||||||||||||||||||||||||||||||||||||||||||||||||||||||||||||||||||||||||||||||||||||||||||||||||||||||||||||||||||||||||||||||||||||||||||||||||||||||||||||||||||||||||||||||||||||||||||||||||||||||||||||||||||||||||||||||||||||||||||||||||||||||||||||||||||||||||||||||||||||||||||||||||||||||||||||||||||||||||||||||||||||||||||||||||||||||||||||||||||||||||||||||||||||||||||||||||||||||||||||||||||||||||||||||||||||||||||||||||||||||||||||||||||||||||||||||||||||||||||||||||||||||||||||||||||||||||||||||||||||||||||||||||||||||||||||||||||||||||||||||||||||||||||||||||||||||||||||||||||||||||||||||||||||||||||||||||||||||||||||||||||||||||||||||||||||||||||||||||||||||||||||||||||||||||||||||||||||||||||||||||||||||||||||||||||||||||||||||||||||||||||||||||||||||||||||||||||||||||||||||||||||||||||||||||||||||||||||||||||||||||||||||||||||||||||||||||||||||||||||||||||||||||||||||||||||||||||||||||||
| Des fortes difficultés dapprovisionnement en œufs |  Le marché français de l’œuf de table manque de plus en plus d’offre. La demande des centres de conditionnement est au rendez-vous, mais les disponibilités manquent et les livraisons sont incomplètes et retardées. Une situation qui pourrait empirer la semaine prochaine avec la mise en œuvre des nouvelles mesures pour limiter la propagation de la grippe aviaire. Du côté des grossistes, les commandes sont un peu plus timides eût égard à la flambée des prix. Néanmoins là encore le manque d’offre conduit à de nouvelles hausses. Hausse des prix des oeufs partout en EuropeLa France dépend de plus en plus des œufs européens, dont les cours continuent de monter. Ainsi la cotation allemande Weser-Ems des œufs bruns de code 3 de calibre L atteint 15,75 €/100 œufs cette semaine, 30 centimes de plus que la semaine précédente et 75 centimes de plus que début février, dans un contexte de fort manque d’offre. Les prix des œufs polonais grimpent depuis 3 semaines. Selon les organisations syndicales de la volaille polonaise, le pays manque d’œufs, la production nationale aurait chuté de 20,5 % en décembre, entre grippe aviaire et envolée des prix du gaz. Les mises en place de poulettes auraient aussi chuté de 35 % au troisième trimestre 2022. Aucun soulagement à attendre de l’autre côté de l’Atlantique, où, selon les données du CDC, la grippe aviaire a conduit à l’abattage de 40 millions de poules cette saison, et les prix des œufs ont bondi de 222 %. |
Francia | Mercados | Otros | Domingo, 26 Febrero 2023 | ||||||||||||||||||||||||||||||||||||||||||||||||||||||||||||||||||||||||||||||||||||||||||||||||||||||||||||||||||||||||||||||||||||||||||||||||||||||||||||||||||||||||||||||||||||||||||||||||||||||||||||||||||||||||||||||||||||||||||||||||||||||||||||||||||||||||||||||||||||||||||||||||||||||||||||||||||||||||||||||||||||||||||||||||||||||||||||||||||||||||||||||||||||||||||||||||||||||||||||||||||||||||||||||||||||||||||||||||||||||||||||||||||||||||||||||||||||||||||||||||||||||||||||||||||||||||||||||||||||||||||||||||||||||||||||||||||||||||||||||||||||||||||||||||||||||||||||||||||||||||||||||||||||||||||||||||||||||||||||||||||||||||||||||||||||||||||||||||||||||||||||||||||||||||||||||||||||||||||||||||||||||||||||||||||||||||||||||||||||||||||||||||||||||||||||||||||||||||||||||||||||||||||||||||||||||||||||||||||||||||||||||||||||||||||||||||||||||||||||||||||||||||||||||||||||||||||||||||||||||||||||||||||||||||||||||||||||||||||||||||||||||||||||||||||||||||||||||||||||
| Canadá: 2 de cada 3 aceitunas consumidas provienen de España | 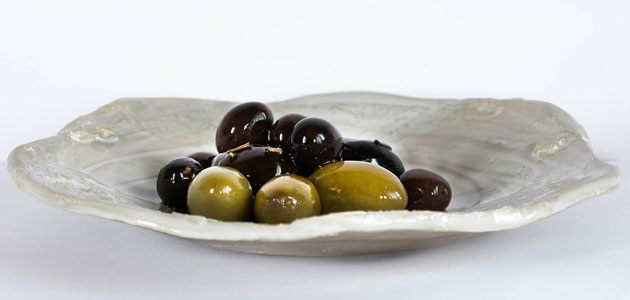 Un estudio de ICEX España Exportación e Inversiones sobre el mercado de la alimentación en Canadá destaca que 2 de cada 3 aceitunas consumidas en este país norteamericano proceden de España. El consumidor canadiense considera las aceitunas un ingrediente fácil de usar y rico en sabor, además de percibirlo como un snack saludable. |
Canadá | Estudios de mercado | Mercados | Otros | Miércoles, 22 Febrero 2023 | ||||||||||||||||||||||||||||||||||||||||||||||||||||||||||||||||||||||||||||||||||||||||||||||||||||||||||||||||||||||||||||||||||||||||||||||||||||||||||||||||||||||||||||||||||||||||||||||||||||||||||||||||||||||||||||||||||||||||||||||||||||||||||||||||||||||||||||||||||||||||||||||||||||||||||||||||||||||||||||||||||||||||||||||||||||||||||||||||||||||||||||||||||||||||||||||||||||||||||||||||||||||||||||||||||||||||||||||||||||||||||||||||||||||||||||||||||||||||||||||||||||||||||||||||||||||||||||||||||||||||||||||||||||||||||||||||||||||||||||||||||||||||||||||||||||||||||||||||||||||||||||||||||||||||||||||||||||||||||||||||||||||||||||||||||||||||||||||||||||||||||||||||||||||||||||||||||||||||||||||||||||||||||||||||||||||||||||||||||||||||||||||||||||||||||||||||||||||||||||||||||||||||||||||||||||||||||||||||||||||||||||||||||||||||||||||||||||||||||||||||||||||||||||||||||||||||||||||||||||||||||||||||||||||||||||||||||||||||||||||||||||||||||||||||||||||||||||||||||||
| Starbucks Introduces Olive Oil-Infused Coffee in Italy |
A new line of cold coffee beverages is made with Sicilian extra virgin olive oil.  By Daniel Dawson Feb. 22, 2023 15:30 UTC Starbucks has presented a new line of olive oil-infused coffee at its locations across Italy. The company plans to introduce the beverage in California in the spring and the United Kingdom, Japan and the Middle East later in the year. Howard Schultz, the company’s interim chief executive, said five new hot and cold brewed beverages would be made with Nocellara del Belice extra virgin olive oil sourced from Partanna, Sicily. I was absolutely stunned at the unique flavor and texture created when the Partanna extra virgin olive oil was infused into Starbucks coffee.- Howard Schultz, interim CEO, Starbucks The Brooklyn native said the inspiration for the new olive oil coffee line came after a trip to Sicily. He was introduced to the custom of drinking a tablespoon of extra virgin olive oil before his morning coffee. Soon after, he started mixing the olive oil with the coffee. “I was absolutely stunned at the unique flavor and texture created when the Partanna extra virgin olive oil was infused into Starbucks coffee,” Schultz said. “In both hot and cold coffee beverages, what it produced was an unexpected, velvety, buttery flavor that enhanced the coffee and lingers beautifully on the palate.” See Also:How to Mix the Perfect EVOO CocktailsAmy Dilger, the company’s principal beverage designer, was charged with creating the new olive oil-infused drinks. After researching extra virgin olive oil, she blended the oil with the company’s blonde espresso roast, which the company describes as having “smooth, well-rounded flavors that are delicious both hot and iced.” Italy is Europe’s third-largest coffee market, with an annual per capita consumption of 5.3 kilograms. However, there has long been plenty of antipathy toward Starbucks. In 2018, Starbucks announced plans to open its first store in Milan, the country’s second-largest city and economic hub. In protest, Italians set fire to some of the palm trees in the Piazza del Duomo, an iconic city landmark where the first store was set to open. Eventually, there was a gradual acceptance of the chain. The decision to launch an olive oil-based line of coffee comes after a flurry of other olive and olive oil beverage infusions. Last March, an entrepreneur in Liguria, a region of northern Italy, launched an olive oil-infused vodka. Like Schultz, he said adding olive oil gave the vodka a velvety texture. In Spain and Italy, two separate companies recently introduced olive-infused beer. Producers in Lazio added olive leaves obtained from pruning to the traditional brewing process, resulting in a smoky taste in the beer. Meanwhile, an award-winning Spanish beer uses Empeltre olive extract, which infuses the flavors, aromas and colors of the olives into the beer. While all three of these products have won regional and international acclaim, it remains to be seen how Italy’s coffee-enthusiastic public takes to the new drinks. Advertisement Related Articles |
Mundial | Mercados | Otros | Italia | Producción | Aceite | Martes, 21 Febrero 2023 | ||||||||||||||||||||||||||||||||||||||||||||||||||||||||||||||||||||||||||||||||||||||||||||||||||||||||||||||||||||||||||||||||||||||||||||||||||||||||||||||||||||||||||||||||||||||||||||||||||||||||||||||||||||||||||||||||||||||||||||||||||||||||||||||||||||||||||||||||||||||||||||||||||||||||||||||||||||||||||||||||||||||||||||||||||||||||||||||||||||||||||||||||||||||||||||||||||||||||||||||||||||||||||||||||||||||||||||||||||||||||||||||||||||||||||||||||||||||||||||||||||||||||||||||||||||||||||||||||||||||||||||||||||||||||||||||||||||||||||||||||||||||||||||||||||||||||||||||||||||||||||||||||||||||||||||||||||||||||||||||||||||||||||||||||||||||||||||||||||||||||||||||||||||||||||||||||||||||||||||||||||||||||||||||||||||||||||||||||||||||||||||||||||||||||||||||||||||||||||||||||||||||||||||||||||||||||||||||||||||||||||||||||||||||||||||||||||||||||||||||||||||||||||||||||||||||||||||||||||||||||||||||||||||||||||||||||||||||||||||||||||||||||||||||||||||||||||||||||||||
| Health and Wellness Series – Organic packaged food trends in Japan | Note: This report includes forecasting data that is based on baseline historical data. Executive summaryThe Japanese market for organic packaged foods, is relatively modest, with sales totaling US$0.4 billion in 2021, fourteenth highest in the world. Although Japan has one of the largest overall non-organic packaged food markets in the world, organic products are currently extremely niche and awareness of the claimed health benefits of organic food is limited. Consequently most Japanese consumers are not willing to pay premium prices for food they do not perceive as superior. The Japanese market for organic packaged foods is also experiencing slow growth. Total retail sales of organic packaged foods grew at a categorized annual growth rate (CAGR) of 1.2% from 2016-2021, and are forecast to grow at a CAGR of 1.4% from 2021 to 2026. These figures lag well behind both global sales growth of organic packaged foods, and domestic sales growth of non-organic packaged foods. The lack of popularity of organic packaged food makes it difficult to access for consumers. Japanese grocery stores often lack organic food, and consequently e-commerce plays a very important role in its distribution. The Japanese economy is extremely large, and Japan is a high-income country. However, the economy suffers from stagnation and Japan's population is also aging rapidly. The Japanese economy has also experienced much more modest inflation than most other high-income countries. Market overviewThe Japanese packaged food market is one of the largest in the world, with total sales being equal to US$180.3 billion. Despite this, the sales for organic packaged food totaled only US$0.4 billion, making Japan the fourteenth largest market for organic packaged food. Organic packaged food is expected to see relatively sluggish growth in the coming years, even as sales of packaged food post dynamic growth. Japan had a GDP of US$4.9 trillion in 2021, making it the third largest economy in the world after the United States and China. Japan has GDP per capita of US$39.3 thousand, the second highest in the Asia pacific region, after Singapore. Although Japan is large and rich, the economy is also suffering from stagnation, and the economy significant growth in decades. Japan's GDP and GDP per capita were both smaller in 2021 than they were in 1997, immediately before the Asian financial crisis. From 2016-2021, GDP grew at a CAGR of −0.1%, and GDP is forecast to grow at a CAGR of 2.1%. The nation also struggles with low levels of domestic demand and regularly experiences deflation. In 2022 Japan abruptly shifted to experiencing the strongest inflation in decades, however inflation levels have remained well below the levels seen in nations such as Canada or the United States. Euromonitor forecasts that inflation for the year 2022 will be 2.2%, followed by 1.5% in 2023. As of 2021, Japan had the highest public debt to GDP ratio of any nation in the world, at 262.5%.
Consumer characteristicsJapan has one of the lowest fertility rates in the world, with 1.3 births per woman as of 2021. The Japanese population is also the second oldest on earth, behind only Monaco. In 2021, Japan's median age was 49.0, forecast by Euromonitor to rise to 54.3 by 2040. In 2021, Japan's dependency ratio was 68.4%, expected to reach 84.7% by 2040. Despite the relatively old population, Japan also has one of the lowest rates of obesity of any developed country, with just 4.8% of the population clinically obese as of 2021. Japanese consumers tend to be uninterested in organic packaged food and tend to be unaware of organic food's purported health benefits and are less concerned about the sustainability of their consumption habits than consumers in similarly wealthy countries. Furthermore, consumers generally have confidence in non-organic products, meaning there is little desire to find a substitute. With little reason to switch to organic products, consumers are heavily deterred by the price of organic food, which tends to be much higher than its non-organic counterpart. Total health and wellness packaged food saw total retail sales of US$23.2 billion in 2021, accounting for 12.9% of the total Japanese packaged food market. Retail sales of organic packaged food grew at a CAGR of 0.7% from 2016-2021, and is forecast to grow at a CAGR of 1.6% from 2021-2026. Fortified and functional products enjoyed the greatest market share in 2021, with US$11.7 billion in sales. Naturally healthy products saw the fastest growth from 2016-2021, followed by organic products. From 2021-2026, "free from" (such as "free from gluten") products are forecast to see the fastest growth followed by naturally healthy.
Market sizeIn 2021, total retail sales of organic packaged food in Japan were equal to US$416.6, making Japan the fourteenth largest for organic packaged food globally, with the Japanese market accounting for less than 1% of global retail sales. Japan had total organic packaged food sales of US$180.3 billion, meaning organic packaged food accounted for just 0.2% of the Japanese packaged food market. The category of packaged food which saw the most organic sales was bread, with organic sales of US$161.2 million. 3.7% of total bread sales were organic in 2021, making it the packaged food subsector with the greatest % share of organic products. In total, organic bread sales accounted for 38.7% of Japanese organic packaged food retail sales. The second largest category was organic sauces dressings and condiments with US$69.8 million in sales and organic rice, pasta, and noodles with US$65.9 million in sales. Both of these subcategories had organic sales which accounted for 0.4% of the market. The market for organic packaged foods saw sluggish growth from 2016-2020, and a slight downturn in 2021. Overall, the market grew at a CAGR of 1.2% from 2016-2021, substantially below the global growth rate of organic packaged food, which occurred at a CAGR of 7.8% over the same period. Moreover, it is also well below the growth rate of retail sales of all packaged food in Japan, which grew at a CAGR of 5.1% over the same period. Sales of organic packaged food in Japan are expected to grow at a CAGR of 1.4% from 2021-2026, compared with the global organic packaged food market which is forecast to grow at a CAGR of 6.7%, and the Japanese packaged food market which is expected to grow at a CAGR of 6.5%. By 2026, it is forecast that total retail sales of organic packaged food in Japan will have reached US$446.5 million, and that Japan will be the sixteenth largest market globally. From 2016-2021, the category of organic packaged food in Japan which saw the fastest growth was confectionary, which saw retail sales grow by a CAGR of 2.5%, followed by breakfast cereals with a CAGR of 2.4%. From 2021-2026 the category of organic packaged food which is expected to grow the fastest is organic baby food with a forecast CAGR of 3.5%, followed by breakfast cereals with a CAGR of 2.1%.
Competition and distributionThe Japanese organic packaged foods market is relatively fragmented. Players in the Japanese market also generally did not have a significant presence across multiple categories of packaged food. The top player, Alce Nero, Gruppo, held a 6.4% share of the total organic packaged food market in 2021 and was only a significant player organic rice, pasta, and noodles category. The next largest player, Takanashi Dairy Co Ltd, held a 3.3% market share, and only had a significant presence in the organic dairy market. The third largest player, Ajisenshioji Co Ltd, had a 1.7% market share and was only a player in the baby food market. The Japanese market for organic packaged foods relies heavily on e-commerce sales, which accounted for 32.6% of the market in 2021, up from 29.4% in 2016. Store based retailing accounted for just 57.8% of sales, playing a significantly smaller role than in countries where organic food is popular. As organic food is generally not popular in Japan, it is often not available at grocery stores, forcing consumers to turn to alternative platforms.
Subsector growthOrganic baby foodThe Japanese market for organic baby food is small, with total sales of US$11.1 million in 2021, and grew at a CAGR of 0.5% from 2016-2021. Sales were mostly prepared baby food, and organic milk formula and dried baby food both had a negligible market presence. Organic milk is not produced domestically in Japan and can only be acquired through expensive foreign brands. Nevertheless, this category is expected to see faster growth from 2021-2026, as Japanese consumers of baby food become more aware of organic food's purported health benefits. Sales are expected to grow at a CAGR of 3.5%, reaching US$13.2 million in 2026. In 2021, 62.7% of sales of organic baby food were attributable to one company, Ajisenshioji Co Ltd.
Organic bread and breakfast cerealsThe market for organic bread in Japan is the largest of any organic packaged food category, with sales of US$161.2 million in 2021. Sales are forecast to grow at a CAGR of 1.6% from 2021-2026, reaching US$174.2 million in 2026. In 2021, 99.7% of sales were artisanal. Sales of breakfast cereals were more modest, totalling US$2.7 million in 2021.
Organic cooking ingredients and mealsOrganic sauces, dressings and condiments were a relatively large category of organic packaged food, with sales totalling US$69.8 million in 2021, while edible oils totalled US$21.5 million and organic spreads totalled US$20.1 million. Organic sauces dressings and condiments are expected to see a CAGR of 1.7% from 2021-2026, making it the category expected to see the second fastest growth. Although organic ready meals are forecast to enjoy a faster calculated growth rate, the sales figures are not reported with enough precision for this to be meaningful. Organic sauces, dressings, and condiments was a fragmented market with the largest player holding a 9.9% market share.
Organic dairyIn 2021, Japanese sales of organic packaged food totalled US$25.8 million, including US$17.4 million in milk and US$8.4 million in cheese. The category grew at a CAGR of 1.2% from 2016-2021 and is forecast to grow at a CAGR of 1.7% from 2021-2026. Sales of organic cheese are forecast to grow at a CAGR of 2.7% from 2021-2026, while organic milk grows at a more sluggish CAGR of 1.2%. Organic dairy is much less popular in Japan than in many peer countries due in part to a lack of domestic organic milk production. Consequently, any organic milk must be sourced from imported foreign brands, that are substantially more expensive than the non-organic milk available to Japanese consumers. Organic milk is not widely available at supermarkets and generally has to be sourced from the internet. Overall, organic milk in Japan is a very niche produce.
Organic rice and pastaOrganic rice and pasta sales in Japan totalled US$65.9 million in 2021. The category saw a temporary spike in sales in 2020 with sales reaching US$$70.8 million, however sales are not expected to again reach this figure by 2026. Sales grew at a CAGR of 1.3% from 2016-2021, and are forecast to grow at a CAGR of 1.3% from 2021-2026. Organic pasta sales are forecast to grow at a CAGR of 1.5%, while organic rice grows at a CAGR of 0.8%. The top company, Alce Nero, Gruppo, controlled 40.3% of sales in 2021.
Organic snacksIn 2021, organic fruit snacks was the largest category of snacks with sales totalling US$18.1 million. However, the category is forecast to see no growth from 2021-2026. In contrast, organic nuts, seeds, and trail mixes, which had total sales of US$15.6 million in 2021, is forecast to grow at a CAGR of 0.9% from 2021-2026. Organic chocolate confectionary, currently valued at US$3.5 million, is forecast to see the fastest growth rate at a CAGR of 0.9%. Organic chocolate confectionary and organic nuts, seeds, and trail mixes are both notable for experiencing positive, albeit modes, sales growth in 2021, while most other categories of organic packaged foods experienced a contraction.
New product launch analysisFrom 2017-2021, Japan saw a total of 204 product launches of organic packaged food, averaging 41 new products per year. A total of 66 new products were launched over this period, making for an average of 13 new products per year. Popular claims included the absence of additives or preservatives, artificial colourings, and products being microwavable. The most common flavour was plain with 65 launches, with the most popular ingredient being salt with 66 launches. The most popular package types were bottles and flexible products.
Examples of new productsOrganic Blood Orange Gummy
This product now retails in a 68g pack, made with fruit juice from organic fruit, and containing 4.2g of collagen. Positioning claims: Limited edition German Potato Seasoning with Pepper & Garlic
This product is not available in a 10.4 gram package which comes with two packets. This product is intended for the preparation of a 5 minute meal combining microwave ingredients and fod froma frying pan. Positioning claims: Ease of Use, Ethical (Charity, environmentally friendly package, sustainable (Habitat/Resources)) Organic Chestnuts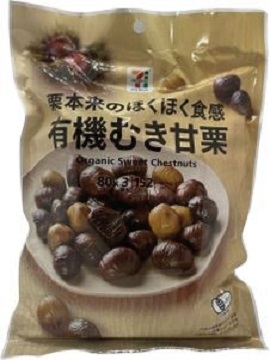
This product has been repackaged to retail in a 240 package with 3 packets. The product can be microwaved, however must be removed from the pack first. Positioning claims: Microwaveable, premium Organic Rice Vinegar
This product has been relaunched with a new brand name, and is made with domestically grown organic rice. The product is described as sour and retails in a 500 millilitre pack. Positioning claims: Not applicable Organic Konjac Noodles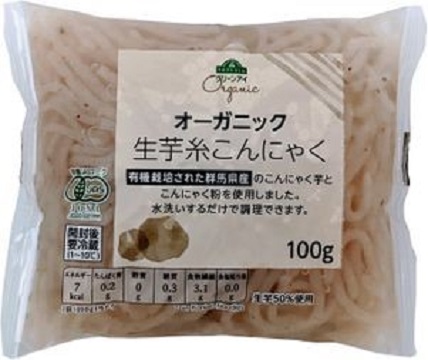
This product has been relaunched and is made with organic konjac grown domestically. The product must be rinsed before use and retails in a 100 gram pack which bears the JAS Organic logo. Positioning claims: Ease of use Instant Organic Oatmeal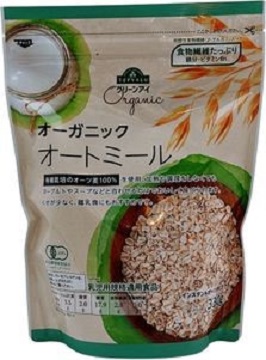
This product, made from organic oats, can be served with yogurt or soup without preparation. It is suitable for babies being weaned, and contains fibre, beta-glucans, iron, and vitamin B1. The product retails in a 330 gram pack with the JAS Organic logo. Positioning claims: Babies and toddlers (0-4), convenient packaging, ease of use, ethical (environmentally friendly package, recycling) high/added fibre, time/speed Soy Sauce Flavour Five Grain Noodles
This product is described as chewy non-fried noodles made from domestically grown grains. It comes with soup and can be prepared in ho water in four minutes, retailed in a 348 gram pack containing 3 packets of noodles and sauce. Positioning claims: Cobranded, time/speed, wholegrain Organic Ceylon Cinnamon Sticks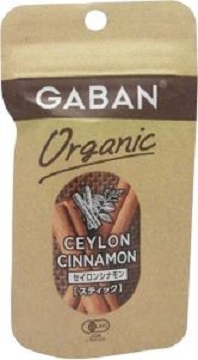
This product retails in a resealable pack containing 2 units and bearing the JAS Organic logo. Positioning claims: Convenient packaging, charity Organic Garlic Powder
This product retails in an 18 gram resealable pack and bearing the JAS Organic logo. Positioning claims: Convenient packaging, charity Organic Peilla Oil
This product has been repackaged and contains the daily recommended serving of alpha-linolenic acid in every 4.6 gram serving and has 30 servings per pack. Positioning claims: Not applicable Organic labellingJapan and Canada currently have an organic equivalency arrangement which includes plants, livestock products, and processed foods of plant origin or containing livestock ingredients. Organic products originating from Canada to Japan must come with an export certificate completed by a Certification Body that is accredited by the Canadian Food Inspection Agency. Canadian products certified as organic under this agreement must bear a Japanese Agricultural Standards seal and may also elect to use the Canada Organic logo. Selling any product which does not bear the Japanese Agricultural Standards with a name such as "organic foods" is prohibited. For more informationThe Canadian Trade Commissioner Service: International Trade Commissioners can provide Canadian industry with on-the-ground expertise regarding market potential, current conditions and local business contacts, and are an excellent point of contact for export advice. More agri-food market intelligence:
International agri-food market intelligence
Agri-food market intelligence service More on Canada's agriculture and agri-food sectors:
Canada's agriculture sectors Resources
Health and Wellness Series – Organic packaged food trends in Japan Prepared by: Brendan Dwyer, Student (co-op) © His Majesty the King in Right of Canada, represented by the Minister of Agriculture and Agri-Food (2023).
Photo credits To join our distribution list or to suggest additional report topics or markets, please contact: Agriculture and Agri-Food Canada, Global Analysis1341 Baseline Rd, Tower 5, 3rd floor Ottawa ON K1A 0C5 Canada Email: Esta dirección de correo electrónico está siendo protegida contra los robots de spam. Necesita tener JavaScript habilitado para poder verlo. The Government of Canada has prepared this report based on primary and secondary sources of information. Although every effort has been made to ensure that the information is accurate, Agriculture and Agri-Food Canada (AAFC) assumes no liability for any actions taken based on the information contained herein. Reproduction or redistribution of this document, in whole or in part, must include acknowledgement of agriculture and agri-food Canada as the owner of the copyright in the document, through a reference citing AAFC, the title of the document and the year. Where the reproduction or redistribution includes data from this document, it must also include an acknowledgement of the specific data source(s), as noted in this document. Agriculture and Agri-Food Canada provides this document and other report services to agriculture and food industry clients free of charge. |
Japón | Estudios de mercado | Mercados | Intersectorial | Otros | Martes, 21 Febrero 2023 | ||||||||||||||||||||||||||||||||||||||||||||||||||||||||||||||||||||||||||||||||||||||||||||||||||||||||||||||||||||||||||||||||||||||||||||||||||||||||||||||||||||||||||||||||||||||||||||||||||||||||||||||||||||||||||||||||||||||||||||||||||||||||||||||||||||||||||||||||||||||||||||||||||||||||||||||||||||||||||||||||||||||||||||||||||||||||||||||||||||||||||||||||||||||||||||||||||||||||||||||||||||||||||||||||||||||||||||||||||||||||||||||||||||||||||||||||||||||||||||||||||||||||||||||||||||||||||||||||||||||||||||||||||||||||||||||||||||||||||||||||||||||||||||||||||||||||||||||||||||||||||||||||||||||||||||||||||||||||||||||||||||||||||||||||||||||||||||||||||||||||||||||||||||||||||||||||||||||||||||||||||||||||||||||||||||||||||||||||||||||||||||||||||||||||||||||||||||||||||||||||||||||||||||||||||||||||||||||||||||||||||||||||||||||||||||||||||||||||||||||||||||||||||||||||||||||||||||||||||||||||||||||||||||||||||||||||||||||||||||||||||||||||||||||||||||||||||||||||||||
| Sector Trend Analysis – Pet food trends in India | Note: This report includes forecasting data that is based on baseline historical data. Executive summaryThe pet population in India has increased significantly by a compound annual growth rate (CAGR) of 11.9% from 18.1 million pets in 2016 to 31.7 million pets in 2021. India was the thirty-ninth largest global market for pet food with imports valued at US$118.2 million (0.6% market share) in 2021, representing a substantial increase in CAGR of 37.8% from US$23.8 million in 2016. Canada was India's seventh largest supplier (representing a 2.0% market share), with imports valued at $US2.4 million, 634,650 kilograms in 2021. Retail sales of pet food in India has increased significantly by 18.5% in CAGR from US$172.5 million in 2016 to US$403.4 million in 2021 and is expected to increase in CAGR by a further 17.1% attaining US$887.6 million by 2026. Dog and cat food were the largest categories in terms of absolute value, with retail sales of US$393.6 million (97.6% market share) and US$9.1 million (2.3% market share) respectively in 2021. The two largest pet food companies in India, Mars Inc and Indian Broiler Group, controlled a combined 66.8% of the total retail market share in 2021, with Mars Inc representing a majority of the market share (52.1%) held. Pet food retail and non-retail sales in India were primarily completed through store-based retailing (47.9%) and non-retail channels (45.2%) in 2021. According to Mintel's Global New Products Database (GNPD), there were 1,056 new pet food products launched in India between January 2016 and December 2021. Dog snacks and treats, dog food dry and cat food wet, were top subcategories of newly released pet food product launches while teeth and tarter prevention, other and vitamin/mineral fortified were top claims associated with new pet food products released during the prescribed period. Pet population and ownershipThe pet population in India has increased significantly by a compound annual growth rate (CAGR) of 11.9% from 18.1 million pets in 2016 to 31.7 million pets in 2021. The pet population is forecast to increase moderately by a CAGR of 9.6% as the pet population is expected to grow to 50.1 million pets by 2026. In 2021, dogs accounted for 87.4% of the pet population (27.7 million) while cats accounted for 9.1% (2.9 million). Of note, cat ownership in India has been historically low due to superstition. Recent efforts by cat food manufacturers to spread awareness of the benefits of cat ownership has encouraged the Indian pet owner to become increasingly receptive to owning a cat (Euromonitor International 2022). Cats, as a choice of pet, attained the largest CAGR of 14.8% as the population increased from 1.5 million in 2016 to 2.9 million in 2021 and are expected to obtain the largest CAGR of 11.1% in the forecast period, as the population increases to 4.9 million by 2026.
India's dog ownership experienced a 9.5% increase in CAGR from 13.9 million households in 2016 to 21.9 million households in 2021. The corresponding percentage of those households owning dogs increased from 5.1% in 2016 to 7.4% in 2021. The number of households owning cats also increased from 1.2 million in 2016 to 1.6 million in 2021 representing an increase in the percentage of those same households owning cats from 0.4% to 0.5% in the same period.
Retail market sizeThe pandemic and the government implemented home seclusion measures fostered a positive influence on pet adoption in India. The need for companionship in particular, has led to an increase in the adoptions of pets, as more citizens spent more time at home to limit the spread of the virus. As such, the local demand for pet care, both pet food and pet products, has benefitted (Euromonitor International, 2022). Pet owners as a consumer, remain largely price conscious. They are however, becoming increasingly focused on the health and wellness of their pets and are spending more on pet dietary supplements and better-quality pet food (Euromonitor International, 2022). Pet foods that incorporate amino acids, omega-3 and omega-6, as well as prepared food are highly valued by pet parents in addressing the nutritional requirements of their pets. Relatedly, social media has played a key role in educating pet owners of new products and increasing sales of pet products and accessories, as owners share photographs and videos of their pets online (Euromonitor International, 2022). Retail sales of pet food in India has increased significantly by 18.5% in CAGR from US$172.5 million in 2016 to US$403.4 million in 2021 and is expected to increase in CAGR by a further 17.1%, attaining US$887.6 million by 2026. Although the rapid increase in pet adoption in India continues to drive sales of pet food in 2022, this growth rate is expected to gradually slow over the course of the forecast period as consumers resume normal routines (Euromonitor International, 2022). Dog and cat food were the largest categories in terms of absolute value, with retail sales of US$393.6 million (97.6% market share) and US$9.1 million (2.3% market share) respectively in 2021, as established brands have continued to move towards healthier products with natural ingredients (Euromonitor International, 2022). The dog food category in particular, attained the largest CAGR of 18.6% in the historic period as retail sales of food increased from US$167.6 million in 2016, and is expected to attain a CAGR of 17.2% with sales of US$870.4 million by 2026 as the pet humanization trend strengthens (Euromonitor International, 2022). Of interest, bird food, despite its lower absolute value of US$0.2 million in 2021, attained measurable increases in CAGR of 14.9% in both periods, while fish food is also expected to increase substantially in CAGR by 20.1% from retail sales of US$0.4 million in 2021 to US$1.0 million by 2026.
Company sharesThe two largest pet food companies in India, Mars Inc and Indian Broiler Group, controlled a combined 66.8% of the total retail market share in 2021, with Mars Inc representing a majority of the market share (52.1%) held. Of the two companies, Indian Broiler Group, experienced the largest CAGR of 4.5% as their market share increased from 11.8% in 2016 to 14.7% in 2021. Of interest, Nestlé SA, despite its lower market share representation of 1.3% held in 2021, made significant advances in CAGR (47.2%) from its entry into the Indian pet food market with a market share representation of just 0.6% in 2019, as Néstle India announced that it will acquire the pet food business from Purina Pet Care to establish entry into the rapidly growing industry in India (Euromonitor International, 2022). Colgate-Palmolive Co in comparison, experienced the largest decline in CAGR of 12.9% as the company's market share decreased from 1.2% in 2016 to 0.6% held in 2021. Private label pet food companies experienced no change in CAGR (0.0%) as their market share remained 0.5% from 2016 to 2021. According to Euromonitor International, Mars International India Pvt Ltd retained its overall lead in pet care in 2021, supported by its strength in the pet food category. The company's success can be attributed to its wide distribution and strong brand presence among local pet owners, in addition to providing products with various pack sizes and products for different breeds. Mars also increased their visibility in the sector by implementing and participating in various marketing campaigns to spread pet adoption awareness, not only of pedigree breeds but also of shelter animals and strays, amidst the pet parent population. Mars has also recently made a significant investment in expanding its factory in Telangana, India to address the increasing demand for prepared pet food in Asia Pacific.
Brand sharesLeading, as well as other pet food manufacturers, are experiencing increasing sales due to the overall growth in demand for pet food. According to Euromonitor International (2022), established brands face competition from online start-ups which operate in niche areas such as organic pet food or health-targeted food products or accessories. Pedigree (Mars Inc) was the largest pet food brand in India with retail sales of US$128.4 million in 2021, representing a moderate increase in CAGR of 18.3% from US$55.4 million in 2016. Royal Canin, the second largest pet food brand from Mars Inc, attained US$73.0 million in 2021, representing an increase in CAGR of 15.2% from retail sales of US$36.0 million valued in 2016. Of interest, retail brand Drools (Indian Broiler Group), attained the largest CAGR of 23.8% in the historic period while retail brand Supercoat (Nestlé SA), attained a notable CAGR of 68.7% from its introduction into the market in 2019 with retail sales of US$1.3 million to US$3.7 million in 2021. Private label pet food brands experienced an increase in CAGR of 17.3% as their retail sales increased to US$2.0 million in 2021 from US$0.9 million in 2016.
Market segmentationDog foodThe pandemic has had a positive impact on the demand for dog food in India. According to Euromonitor International (2022), the home seclusion measures implemented in early 2020 led to increasing pet adoption rates into 2021. Dog adoption rates have increased and are expected to continue as Indian families become increasingly nuclear, fostering the need to adopt for companionship. Further, the pet humanization trend continues to increase as more dog parents are spending more on dog food. Economy dry dog food remains the most dynamic performer in the category as most consumers remain price conscious (Euromonitor International 2022). Total retail sales of dog food in India reached US$393.6 million in 2021, growing a measurable 19.5% as retail sales increased from US$329.4 million in 2020. The dog food market grew at an equally measurable CAGR of 18.6% between 2016 and 2021. In absolute value terms, dry dog food was the largest subcategory with retail sales of US$347.7 million (88.3% market share) in 2021, growing 18.8% in CAGR from retail sales of US$147.0 million in 2016. Economy dry dog food in particular, grew 22.4% from retail sales of US$195.1 million in 2020 to US$238.8 million in 2021. Further, all subcategories of dry dog food experienced large increases in CAGR's ranging from 10.7% to 19.8% in the historic period, while mid-priced wet dog food experienced a CAGR of 12.3% during the same period. Dog treats and mixers were the second largest retail subcategory with retail sales of US$41.8 million in 2021 (10.6% market share), as pet owners used treats and mixers as snacks for their dogs, helping to build closer bonds with their pets (Euromonitor International 2022). Growth in the dog food category is expected to be strongly positive with a CAGR of 17.2% as retail sales attain US$870.4 million by 2026, as more consumers increasingly understand the nutritional benefits provided in dog food versus home-prepared food for their dogs (Euromonitor International 2022). The pet humanization trend however, is expected to subside in the forecast period as pandemic restrictions ease, and busy lifestyles resume, effecting time and money spent on premium products for their dogs (Euromonitor International 2022). In particular, dry dog food subcategories are expected to again experience positive increases in CAGR's, albeit at slightly lower rates in the forecast period, in comparison to the CAGR's achieved between 2016 to 2021. Retail sales of dog treats and mixers are expected to attain US$90.0 million by 2026.
Mars International India Pvt strengthened its overall leadership in dog food in 2021 offering a diverse portfolio of products and benefits due to strong brand presence and loyalty among dog owners (Euromonitor International, 2022). Mars Inc and Indian Broiler Group remained the leading companies for dog food with value market share representation of 51.5% and 15.0% in 2021, despite Mars Inc slight decline in CAGR of 1.3% as their market share decreased from 55.0% recorded in 2016. In comparison, Indian Broiler Group did experience the largest increase in CAGR of 4.4% as their market share grew from 12.1% held in 2016, while Nestlé SA grew in CAGR by 47.2% as their market share grew from 0.6% to 1.3% between 2019 and 2021. Private label dog food companies represented a 0.5% market share in 2021, remaining stable (unchanged) from a market share representation of 0.5% also held in 2016.
Cat foodIndia's cat population and adoption rate has increased, also encouraged by the home seclusion measures implemented in response to the recent pandemic. Although India's cat adoption rate remains low (less than 1.0% in 2022), it is expected to grow significantly as cats tend to demand less attention and maintenance in comparison to dogs, and remain popular with young couples and children, as well as nuclear households (Euromonitor International 2022). Retail sales of cat food in India reached US$9.1 million in 2021, growing 13.8% from US$8.0 million in 2020. The cat food market grew at a CAGR of 15.1% between 2016 and 2021. Dry cat food was the largest subcategory in absolute value terms, recording retail sales of US$7.8 million (85.7% market share) in 2021, and expanding by a CAGR of 15.5% from 2016 to 2021. In particular, the premium segment held a substantial share of retail sales (US$6.7 million in 2021) within the dry cat food category due, in part, to the tendency of urban cat owners to overspend on their pet's food (Euromonitor International 2022). In comparison, wet cat food attained retail sales of US$1.4 million (15.4% market share) in 2021 and grew in CAGR by 11.8% from retail sales of US$0.8 million in 2016. Retail sales of cat food will continue to grow throughout 2021-2026 with an expected CAGR of 11.7%, achieving US$15.8 million by 2026. Retail sales in mid-priced dry cat food will increase in a comparable CAGR of 14.9% while premium dry cat food will experience a lower CAGR of 11.2% in the forecast period. Similarly, premium wet cat food will also experience a slightly lower CAGR of 11.4% during the same period. Of interest, as cat adoption rates are higher among women and nuclear families with higher disposable incomes, the potential for cat treats and mixers as a lucrative segment for future expansion exists (Euromonitor International 2022).
Mars Inc was the main (largest) cat food company in India accounting for a notable retail market share representation of 79.2% in 2021. Indian Broiler Group, the second largest cat food company, experienced the largest increase in CAGR of 7.3% as their market share grew from 2.6% in 2016 to 3.7% in 2021. Midwestern Pet Foods Inc experienced the largest decline in CAGR as their market share representation declined from 0.2% in 2016 to 0.1% in 2021. Mars International India Pvt Ltd maintained its leadership position in the cat food sector due mainly to their strong market presence of their popular brand Whiskas. Mars also expanded its cat food range in India in 2021 by introducing new products such as Whiskas Tasty Mix Wet Cat Food and Iams cat food to pet shops, grocery stores and e-commerce platforms (Euromonitor International 2022).
Other pet foodSimilar to dog and cat adoption, the pandemic has also accelerated the adoption of other pets such as fish and birds for companionship, as they require less space and attention compared to cats and dogs (Euromonitor International 2022). Retail sales of other pet food increased at a moderate CAGR of 12.6% from US$354.0 thousand in 2016 to US$640.2 thousand in 2021. Euromonitor International notes the potential for growth in the other pet food as a category, due partly, to the fragmented and disorganized competitive landscape inherent to this particular market. Specifically, other pet owners are largely unaware of product alternatives and (established/non-established) brands for their pets, as available product information is lacking, creating the opportunity for greater consumer product awareness and purchases, in the forecast period. Other pet food is forecast to increase at a larger CAGR of 16.7% as retail sales are expected to reach US$1,385.3 thousand by 2026. Fish food was the largest category of other pet food in absolute value terms with retail sales of US$442.1 thousand (69.1% market share) in 2021, growing 11.3% in CAGR from retail sales of US$258.9 thousand in 2016. According to Euromonitor International 2022, in addition to the extensive variety of exotic fish and aquariums available for purchase, having a fish as a pet supports a relevant trend (visual element) in home décor. Many pet parents also own small turtles and other aquatic pets such as miniature crabs (Euromonitor International, 2022). Growth in the fish food category is expected to be strongly positive with a larger CAGR of 17.9% as retail sales reach US$1,005.6 thousand by 2026. Owning a bird for a pet is a tradition in India and their care requires limited time and responsibility. Parakeets, parrots and lovebirds are the most commonly kept house birds (Euromonitor International, 2022). Retail sales of bird food experienced leading value growth of 16.5% from US$156.7 thousand in 2020 to US$182.6 thousand in 2021 and is expected to attain further growth of 15.4% reaching US$210.8 thousand by 2022. During the 2016-2021 period, retail sales of bird food experienced the largest increase in CAGR of 16.5% from US$85.1 thousand held in 2016. Retail sales of bird food are forecast to increase by a CAGR of 14.2% attaining US$354.9 thousand by 2026, as pandemic restrictions ease, making the adoption of birds likely to continue (Euromonitor International, 2022). Retail sales of small mammal/reptile food was valued at US$15.5 thousand in 2021. During the historic period, the category grew at a CAGR of 8.9% from US$10.1 thousand in 2016 and is expected to increase in CAGR by 9.9% to US$24.8 thousand by 2026.
Other pet food was a fairly fragmented competitive environment in the historic period. Tropical Industry, Vitakraft Pet Care GmbH & Co KG and Pacific Blue Taiwan were the largest other pet food companies in India with combined market shares of 32.0% in 2021, with Tropical Industry increasing the largest in CAGR of 5.1% of the three companies, as their market share representation grew from 11.0% held in 2016 to 14.1% in 2021. In comparison, Premium Nutritional Products Inc experienced the largest increase in CAGR of 5.4% to a 2.6% market share in 2021, despite their lower market share representation of 2.0% held in 2016. Of note, Far East Freeze & Drying Mfg Co Ltd experienced the largest decline in CAGR of 11.0% as the company's market share decreased from 3.4% held in 2016 to 1.9% in 2021.
Distribution channelsPet food retail and non-retail sales in India were primarily completed through store-based retailing (47.9%) and non-retail channels (45.2%) in 2021. Of note, of the distribution channels available (store-based, non-store retailing and non-retail), only store-based retailing declined slightly in CAGR by 2.3% as their market share representation declined from 53.9% held in 2016 to 47.9% in 2021. Of the store-based retailing distribution channels available, pet shops (non-grocery specialists) were the largest distribution channel for pet food with a 43.2% market share, while in the non-retail distribution channels, veterinary clinics held a 45.2% market share in 2021. In comparison, within non-store retailing distribution, e-commerce represented a 6.9% market share in 2021 and experienced the largest increase in CAGR (13.3%) of all the distribution channels, as their market share representation grew from 3.7% held in 2016. E-commerce, according to Euromonitor International, has witnessed a proliferation of new-start-up companies that offer a variety of pet food and products compared to available established products and brands in traditional brick-and-mortar stores. The emergence and anticipated continuation of such start-ups signifies the increasing prevalence of the pet humanisation trend in India, in addition to the increasing penetration of e-commerce as a pet food distribution channel (Euromonitor International, 2022). Further, e-commerce is expected to gain further significant share over the forecast period as social media pet photo and video product sharing will influence pet owners to search, compare and select the best products for their pets (Euromonitor International, 2022). In relation to dog food sales, the pandemic served to accelerate the frequency of online shopping and range of available products, and as restrictions ease, the convenience, anytime ordering and quick delivery, will remain relevant to the consumer. Relatedly, the proliferation of online services such as Heads Up For Tails, Petsworld, Petsy Online, and Purprise along with the established third party platform Amazon and Flipkart, has expanded the visibility and accessibility of online sales of dog food in India (Euromonitor International, 2022). Similar to e-commerce dog food sales, increases in e-commerce cat food sales were also accelerated by the pandemic as convenience and the perceived safety of home delivery fostered dynamic growth rates, a trend expected to continue over the forecast period as consumers resume their busy lifestyles (Euromonitor International, 2022). E-commerce has also benefitted other pet food sales which have tripled in comparison to pre-pandemic levels, and the potential growth of e-commerce remains as consumers can access a wider range of other pet products and brands online while the channel also offers greater access to the consumer audience compared to small pet shops (Euromonitor International, 2022). Of interest, within other store-based retailing distribution channels, (modern grocery retailers) hypermarkets and supermarkets attained a 1.9% and 1.3% market share respectively while traditional grocers attained a 0.9 % market share in 2021.
Trade overviewGlobal importsThe global market for pet food has experienced positive growth and increased in CAGR by 12.8% as imports have risen from US$11.3 billion in 2016 to US$20.6 billion in 2021. Germany was the largest market for pet food with imports valued at US$2.0 billion (9.6% market share), followed by the United States (U.S) with US$1.5 billion (7.5% market share), and Poland with imports worth US$1.1 billion (5.6% market share) in 2021. India was the thirty-ninth largest global market for pet food with imports valued at US$118.2 million (0.6% market share) in 2021, representing a substantial increase in CAGR of 37.8% from US$23.8 million in 2016. In comparison, Canada was the fifth largest global market for pet food with imports of US$1.1 billion (5.2% market share) in 2021, representing a moderate increase in CAGR of 11.4% from pet food imports of US$621.4 million in 2016.
India importsIndia has a diverse supply network of pet food providers. Thailand, South Africa and Spain were the largest suppliers of pet food to India in 2021 with values of US$62.3 million (52.7% market share), US$19.2 million (16.3% market share) and US$6.3 million (5.3% market share) respectively. In terms of value, each of the top exporting countries have experienced positive growth in their supply of pet food to India varying from 30.4% (Hungary) to the largest CAGR's of 136.8% (Indonesia), 373.1% (Croatia 2019-2021) and 121.2% (South Africa 2017-2021). Canada in comparison, as India's seventh largest pet food supplier, experienced a significant increase in CAGR of 66.2% as pet food values grew from US$0.2 million in 2016 to US$2.4 million in 2021.
India pet food import requirementsTo prevent the entry of any Exotic Livestock Diseases into India through the importation of livestock & livestock products, the provisions of the Livestock Importation Act, 1898, are in operation. (Food Safety Standards Authority of India [FSSAI], Government of India; Food Regulatory Portal - Regulatory Requirements and Procedure for Food Imports). The import of livestock products to India are permitted and subject to Sanitary Import Permits (SIPs), as per the provisions of the Livestock Importation act, 1898. A Sanitary Import Permit is not a licence, but a certificate confirming India's sanitary requirements for livestock products including; meat and products of all kinds of including fresh, chilled and frozen meat, tissue or poultry, pig, sheep and goat, egg and egg powder, milk and milk products, bovine, ovine and caprine embryos, ova or semen; and pet food products of animal origin. (Food Safety Standards Authority of India [FSSAI], Government of India]; Food Regulatory Portal - Regulatory Requirements and Procedure for Food Imports). Imports of animal and animal products are only allowed through the designated seaports/airports of Bangalore, Chennai, Delhi, Hyderabad, Kolkata, and Mumbai where animal quarantine and certification services are available. Imports of fish products are allowed through the seaport of Vishakhapatnam (in the State of Andhra Pradesh), Sea and airport of Kochi and the Land Custom Station at Petra pole (for imports from Bangladesh only). (Food Safety Standards Authority of India [FSSAI], Government of India; Food Regulatory Portal - Regulatory Requirements and Procedure for Food Imports) Canadian pet food export policiesThe Canadian Food Inspection Agency (CFIA) provides verification and certification services for pet foods that are made in Canada and intended for export. Pet foods exported from Canada may need to have an official zoo sanitary health certificate which confirms that the sanitary requirements of the importing country have been met (the CFIA negotiates import conditions with the importing country's veterinary officials). Further, the CFIA provides inspections of Canadian export manufacturing establishments in order to verify that the products, manufacturing facilities, and practices meet the importing country's market access requirements. (CFIA; Export policies: pet food) (Excerpts from Pet Webinar; Pet Food Import Requirements - India, Dr. Mwate Mulenga, Counsellor Agriculture & Technical Specialist Abroad - CFIA, August 29, 2022) Canadian producers have an opportunity to expand their exports and products within the Indian pet food sector. That said, it is important for Canadian suppliers to work closely with their importing partners and Trade Commissioners to understand and ensure that India's import requirements for their specific products are met. For more information on the roles and responsibilities of exporters and the CFIA, supporting documents (Exporter's Declaration, Traceability Certificate and other supporting documents), and a listing of requirements from importing countries (Asia - India/Certificate HA2870), exporters are encouraged to consult the Guideline for preparing export certificates for the Canadian pet food industry. (CFIA; Export policies: pet food) Canada's performanceIndia was the thirty-ninth largest global market for pet food with imports valued at US$118.2 million (0.6% market share) in 2021, representing a substantial increase in CAGR of 37.8% from US$23.8 million in 2016. Of the US$118.2 million of pet food imported by India, Canada was India's seventh largest supplier (representing a 2.0% market share), with imports valued at US$2.4 million, 634,650 kgs in 2021.
Canada exported US$2.7 million, 765,011 kilograms of pet food to India in 2021. The top pet food supplying Canadian province was Alberta, occupying a market shares of 99.1%, while the remaining 0.9% market share was supplied by Ontario in 2021.
Product launch analysisAccording to Mintel's Global New Products Database (GNPD), there were 1,056 new pet food products launched in India between January 2016 and December 2021. The number of yearly product launches has declined slightly in growth by a CAGR of 0.1% from 142 pet products in 2016 to its most recent launch of 141 pet products in 2021. Dog snacks and treats, dog food dry and cat food wet, were top subcategories of newly released pet food product launches while teeth and tarter prevention, other and vitamin/mineral fortified were top claims associated with new pet food products released during the prescribed period. Flexible, flexible stand-up pouch and jar were the predominant package types released, while new product, new variety/range extension and new packaging launch types were the leading product attributes of new pet food products released between January 2016 and December 2021. Unflavoured/plain, chick and tuna were top flavours (including blends), while chicken meat, minerals and vitamins were top ingredients identified during this period.
Examples of new productsStrawberry Flavoured Dog Biscuits Source: Mintel, 2022
Nootie Strawberry Flavoured Dog Biscuits are described as a scrumptiously tasty and nutritious treats that are great for training and rewarding. The biscuits are made with whole wheat flour and have high content of calcium and protein, which are said to improve bones and muscles, essential vitamins and minerals, which help maintain the dog's natural defences. They are also claimed to support skin health and fitness, and retail in a 750 gram pack. Chicken & Liver Flavoured Food for Adult Dogs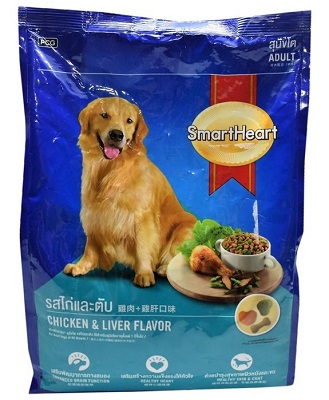 Source: Mintel, 2022
PCG SmartHeart Chicken & Liver Flavoured Food for Adult Dogs has been added to the range. The product is said to be formulated to meet adult dog's requirements using the best quality ingredients, and contains DHA from fish oil and choline from lecithin for enhanced brain and nervous system function; omega-3 fatty acids from fish oil for a healthy heart; balanced omega-3 and omega-6 essential fatty acids for a healthy skin and shiny coat; vitamin E and selenium for strong immune system; highly digestible ingredients for improved digestion and stool quality; and calcium and phosphorus for strong bones and teeth. It is said to provide a complete and balanced nutrition, and is ISO 9001 and 14001, GMP and HACCP certified. The product retails in a 1.5 kilogram pack featuring a QR code and a Facebook reference. Tuna with Chicken Flake in Jelly for Adult Cats Source: Mintel, 2022
PCG Me-O Delite Tuna with Chicken Flake in Jelly for Adult Cats is now available. The product is made from real fish and contains taurine, biotin, zinc and vitamin C. It is suitable for cats from one year onwards and retails in a 70 gram pack bearing Facebook address. Freshly Prepared Salmon with Olive Oil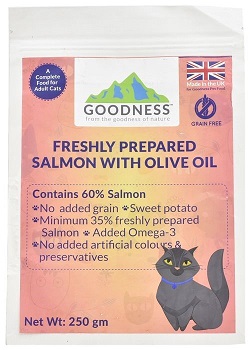 Source: Mintel, 2022
Goodness Freshly Prepared Salmon with Olive Oil is grain free and contains 60% salmon, sweet potato and a minimum of 35% freshly prepared salmon with added omega-3. This complete food for adult cats contains no added artificial colours or preservatives and is retailed in a 250 gram pack. Combo Pack for Puppy Source: Mintel, 2022
Pedigree Combo Pack for Puppy has been repackaged with an updated pack design. The product comprises a nutritious meal with tasty meat gravy, and combines nutritious kibbles and delicious gravy in an easy pour-mix-serve format. It contains a tasty, wholesome meal for pets which is sufficient for one to two days. It comprises vitamins and minerals for a strong immune system, protein for strong muscles, ensures a superior digestion of nutrients, features optimal Ca:P ratio for strong bones and teeth, and a blend of zinc and omega fatty acids for healthy skin and coat. According to the manufacturer, the recipe has been developed to provide dogs with the five signs of good health which are: healthy skin and coat, strong bones and teeth, healthy digestive system strong muscles and stronger immune system. The product retails in a 480 gram pack comprising: a 400 gram pouch of Pedigree Puppy Chicken and Milk, and an 80 gram pouch of Pedigree Puppy Chicken Chunks Flavour in Gravy, and featuring the Facebook link. For more informationThe Canadian Trade Commissioner Service: International Trade Commissioners can provide Canadian industry with on-the-ground expertise regarding market potential, current conditions and local business contacts, and are an excellent point of contact for export advice. More agri-food market intelligence:
International agri-food market intelligence
Agri-food market intelligence service More on Canada's agriculture and agri-food sectors:
Canada's agriculture sectors For additional information on the upcoming trade show India International Pet Trade Fair (IIPTF), please contact:
Nitin Verma [he/him] Resources
Sector Trend Analysis – Pet food trends in India Prepared by: Laurie Bernardi, International Market Analyst © His Majesty the King in Right of Canada, represented by the Minister of Agriculture and Agri-Food (2023).
Photo credits To join our distribution list or to suggest additional report topics or markets, please contact: Agriculture and Agri-Food Canada, Global Analysis1341 Baseline Rd, Tower 5, 3rd floor Ottawa ON K1A 0C5 Canada Email: Esta dirección de correo electrónico está siendo protegida contra los robots de spam. Necesita tener JavaScript habilitado para poder verlo. The Government of Canada has prepared this report based on primary and secondary sources of information. Although every effort has been made to ensure that the information is accurate, Agriculture and Agri-Food Canada (AAFC) assumes no liability for any actions taken based on the information contained herein. Reproduction or redistribution of this document, in whole or in part, must include acknowledgement of agriculture and agri-food Canada as the owner of the copyright in the document, through a reference citing AAFC, the title of the document and the year. Where the reproduction or redistribution includes data from this document, it must also include an acknowledgement of the specific data source(s), as noted in this document. Agriculture and Agri-Food Canada provides this document and other report services to agriculture and food industry clients free of charge. |
Mundial | Mercados | Estudios de mercado | Otros | Martes, 21 Febrero 2023 | ||||||||||||||||||||||||||||||||||||||||||||||||||||||||||||||||||||||||||||||||||||||||||||||||||||||||||||||||||||||||||||||||||||||||||||||||||||||||||||||||||||||||||||||||||||||||||||||||||||||||||||||||||||||||||||||||||||||||||||||||||||||||||||||||||||||||||||||||||||||||||||||||||||||||||||||||||||||||||||||||||||||||||||||||||||||||||||||||||||||||||||||||||||||||||||||||||||||||||||||||||||||||||||||||||||||||||||||||||||||||||||||||||||||||||||||||||||||||||||||||||||||||||||||||||||||||||||||||||||||||||||||||||||||||||||||||||||||||||||||||||||||||||||||||||||||||||||||||||||||||||||||||||||||||||||||||||||||||||||||||||||||||||||||||||||||||||||||||||||||||||||||||||||||||||||||||||||||||||||||||||||||||||||||||||||||||||||||||||||||||||||||||||||||||||||||||||||||||||||||||||||||||||||||||||||||||||||||||||||||||||||||||||||||||||||||||||||||||||||||||||||||||||||||||||||||||||||||||||||||||||||||||||||||||||||||||||||||||||||||||||||||||||||||||||||||||||||||||||||
| Upcycling food waste to grow ‘highly nutritious mycelium protein | 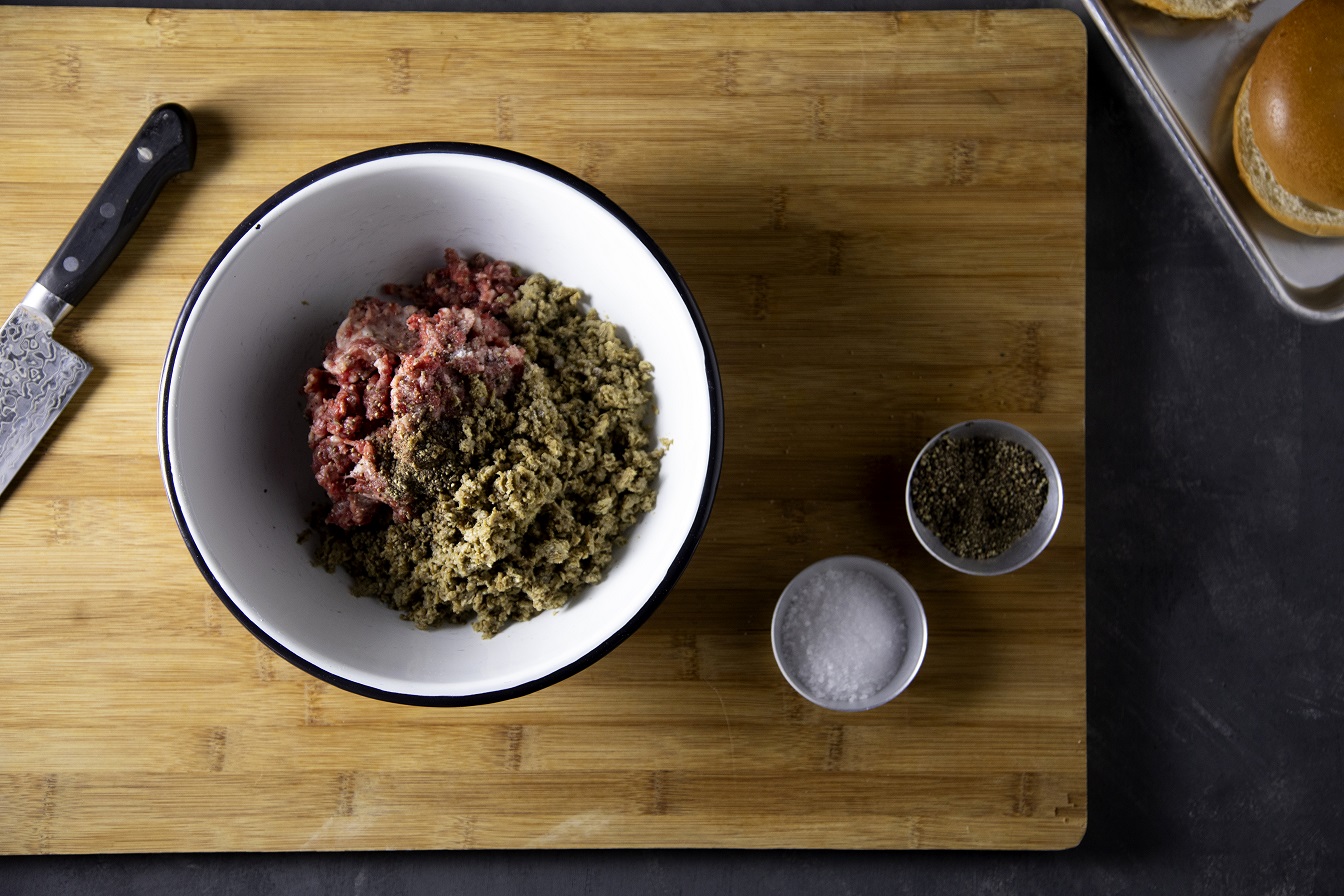 A portfolio company of the Strauss Group Kitchen FoodTech Hub, Mush Foods has announced it has successfully developed its mycelium protein ingredient solution, called 50CUT, to slash the animal protein content in meat products by 50%. Mushroom-derived 50CUT delivers a ‘beefy bite’ of nutrient-dense protein to meat hybrid formulations that appeal to even the most devoted meat lovers, the company claimed. “Our mushroom-derived products address the reality that there is a sizeable population of carnivores who are simply not willing to compromise on beef’s rich taste, nutritional boost, and textural experience,” said Shalom Daniel, co-founder and CEO of Mush Foods. “50CUT is tailored specifically for hybrid meat products to satisfy flexitarians and carnivores with the unique sensation they crave, while easing the impact of global meat consumption.” A blend of three edible mushroom mycelium speciesThe product is made up of three edible mushroom mycelium species. “By combining different types of mycelium we can create a unique ingredient which perfectly pairs with the particular taste, formability, texture, aroma, and even colour of beef,” said Dan Levanon, PhD, co-founder and Chief Scientific Officer of Mush Foods. “Once you add 50CUT to ground beef, it acts like a sponge and absorbs all the water, juiciness, fat, aromatic compounds, and assumes the visual appearance of the beef. From the full organoleptic and nutritional perspectives, 50CUT functions as the perfect complement to beef, enhancing its taste.” The mycelium network is a thread-like, root-like underground system of fungi. It breaks down forest plant matter, effectively nourishing the mushrooms growing above ground as well as the surrounding ecosystem. Mush Foods’ proprietary technology for upcycling food side streams from local manufacturers was initially developed at the MIGAL Galilee Research Institute in Israel. “We grow the mycelium above the ground in indoor farms using a highly efficient method,” explained Idan Pereman, PhD, co-founder and Mycology Director for Mush Foods. “Our fermentation platform recreates the underground growth conditions, without light and uses minimal land, energy, and water. After harvesting, we produce the mycelium in a 100% natural process, with gentle preparing and shaping, reducing liquid to create a final product which contains no additional ingredients, binders, additives or flavourings.” Why hybrid?Hybrid combinations of meat and plant proteins can help combat the formulation challenges currently facing the plant-based sector. Despite new product development and heavy promotions from retailers, taste and price of meat-free products are still the major barriers for shoppers. “There are several challenges that are holding back the wide adoption of foods which are 100% plant-based, keeping its market share at unsatisfying levels,” said Amir Zaidman, Chief Business Officer of The Kitchen FoodTech Hub. Mush Foods solution tackles these challenges and has the potential of widespread adoption, he insisted. “Having a million people cutting their meat consumption by 50% is a lot more likely to make an impact than one hundred thousand giving up on meat altogether. For this reason, we are sure Mush Foods will be a gamechanger.” Mycelium can further claim nutritional credentials. It is a whole protein, housing all the essential amino acids. It is rich in fibre and vitamins and contains no saturated fat, no cholesterol, and acts as a natural binder. Unlike other alternative proteins, mycelium possesses a natural umami flavour similar to meat, eliminating the need for masking agents or added flavours. Mush Foods stressed that it boosts the flavour of the meat product, while contributing to the meat-like texture and aroma. In formulations, the mycelium fibres maintain the volume of the ground meat matrix by absorbing the meat juices, further preserving flavour and making the addition of fillers such as texturized proteins unnecessary. Circular economyMush Foods' mycelium ingredient requires no agricultural land and uses minimal energy and water. Cultivation does not depend on season or climate. “Our mycelium ingredient is grown from food waste, making it highly sustainable and exerting a minimum carbon footprint,” added Daniel. “It also grows exceptionally fast: While it takes a year to grow a cow, and four months to grow soy, it takes only eight-ten days to grow mycelium, making it a highly scalable—and affordable—option.” In a November 2022 pilot study of 4,000 participating employees drawn from various financial institutions in New York, Mush Foods’ 50CUT hybrid beef and mycelium burger scored the highest out of 11 main dish options. “The encouraging results reflect a consumer demand for this kind of alternative,” said Daniel. “To make a true impact, the product must benefit consumers and food companies as well as restaurateurs. All are attuned to evolving food trends and do not want to compromise when seeking quality alternatives that are affordable, nutritious, tasty, and kind to the planet, Mush Foods ticks all the right boxes.” |
Mundial | Mercados | Producción | Otros | Martes, 21 Febrero 2023 | ||||||||||||||||||||||||||||||||||||||||||||||||||||||||||||||||||||||||||||||||||||||||||||||||||||||||||||||||||||||||||||||||||||||||||||||||||||||||||||||||||||||||||||||||||||||||||||||||||||||||||||||||||||||||||||||||||||||||||||||||||||||||||||||||||||||||||||||||||||||||||||||||||||||||||||||||||||||||||||||||||||||||||||||||||||||||||||||||||||||||||||||||||||||||||||||||||||||||||||||||||||||||||||||||||||||||||||||||||||||||||||||||||||||||||||||||||||||||||||||||||||||||||||||||||||||||||||||||||||||||||||||||||||||||||||||||||||||||||||||||||||||||||||||||||||||||||||||||||||||||||||||||||||||||||||||||||||||||||||||||||||||||||||||||||||||||||||||||||||||||||||||||||||||||||||||||||||||||||||||||||||||||||||||||||||||||||||||||||||||||||||||||||||||||||||||||||||||||||||||||||||||||||||||||||||||||||||||||||||||||||||||||||||||||||||||||||||||||||||||||||||||||||||||||||||||||||||||||||||||||||||||||||||||||||||||||||||||||||||||||||||||||||||||||||||||||||||||||||||
| From microwave to mushrooms – compostable DualPakECO trays |  DualPakECO trays are certified compostable to the Australian standard AS4736 2006. They are made in Australia with paper coated on the inside with BASF biopolymer ecovio® PS 1606. Composting trials have shown that the DualPakECO trays break down into water, carbon dioxide and nutrient-rich compost within four to six weeks under commercial composting conditions. Composting is the most resource-efficient process for food waste recycling. DualPakECO supports a circular economy as it contributes to the diversion of food waste and food-soiled packaging from landfills, thus avoiding associated greenhouse gas emissions. This new certified compostable solution is an alternative to conventional PET packaging for ready-to-eat and delivered meals. Food-soiled PET packaging is not suitable for recycling so ends up in landfill. Commercial composting is an integral part of a circular economy where organic waste can be turned into a valuable resource rather than be disposed of in landfill or incinerated. Compost from organic recycling can be used in agriculture to improve degraded soils and return organic matter to soils ensuring future productivity. The new packaging solution is suitable for organics recycling such as the Australian FOGO (Food Organics and Garden Organics). This curbside collection service allows food scraps to be added to the garden waste bin so they can be recycled into high-quality compost. Through the National Waste Policy Plan, Australia’s states and territories have committed themselves to increasing FOGO collection services, agreeing to introduce them to all households and businesses by the end of 2023. DualPakECO trays can be frozen or refrigerated and are ovenable for 40 minutes, up to 180 degrees as well as being microwave safe. They can go from the freezer to microwave to the table to the composting facility and back to the farm to help provide nutrients for the next crop. Finding a market for any recycled material is critical to the success of a circular economy, ensuring resources retain value through the process. Composting is the ultimate in recycling as the result can be so beneficial to agriculture and viticulture, as well as the environment. Compost and mulch can improve soil quality and assist with water retention and drought mitigation. All organic materials contain both carbon and nitrogen – green materials like garden waste and food scraps are richer in nitrogen and brown materials such as straw, sawdust and paperboard are richer in carbon. The perfect recipe for optimum biological activity and efficient compost production requires a balance of carbon and nitrogen in the material being composted. Packaging like DualPakECO trays can become an essential part of the composting process, reducing waste to landfill, creating a valuable resource, balancing production and helping to nourish the plants that put food on the table. For more information visit www.confoil.com.au. |
Australia | Mercados | Producción | Otros | Martes, 21 Febrero 2023 | ||||||||||||||||||||||||||||||||||||||||||||||||||||||||||||||||||||||||||||||||||||||||||||||||||||||||||||||||||||||||||||||||||||||||||||||||||||||||||||||||||||||||||||||||||||||||||||||||||||||||||||||||||||||||||||||||||||||||||||||||||||||||||||||||||||||||||||||||||||||||||||||||||||||||||||||||||||||||||||||||||||||||||||||||||||||||||||||||||||||||||||||||||||||||||||||||||||||||||||||||||||||||||||||||||||||||||||||||||||||||||||||||||||||||||||||||||||||||||||||||||||||||||||||||||||||||||||||||||||||||||||||||||||||||||||||||||||||||||||||||||||||||||||||||||||||||||||||||||||||||||||||||||||||||||||||||||||||||||||||||||||||||||||||||||||||||||||||||||||||||||||||||||||||||||||||||||||||||||||||||||||||||||||||||||||||||||||||||||||||||||||||||||||||||||||||||||||||||||||||||||||||||||||||||||||||||||||||||||||||||||||||||||||||||||||||||||||||||||||||||||||||||||||||||||||||||||||||||||||||||||||||||||||||||||||||||||||||||||||||||||||||||||||||||||||||||||||||||||||
Página 1 de 45


